7 Assessment Results
Chapter 7 of the Dynamic Learning Maps® (DLM®) Alternate Assessment System 2015–2016 Technical Manual—Science (Dynamic Learning Maps Consortium, 2017) describes assessment results for the 2015–2016 academic year, including student participation and performance summaries, and an overview of data files and score reports delivered to state education agencies. Technical Manual updates provide a description of data files, score reports, and results for each corresponding academic year.
This chapter presents Spring 2021 student participation data; the percentage of students achieving at each performance level; and subgroup performance by gender, race, ethnicity, and English learner status. This chapter also reports the distribution of students by the highest linkage level mastered during Spring 2021. Finally, this chapter describes updates made to score reports during the 2020–2021 operational year. For a complete description of score reports and interpretive guides, see Chapter 7 of the 2015–2016 Technical Manual—Science (Dynamic Learning Maps Consortium, 2017).
In this chapter we describe the results that were reported as part of the 2020–2021 assessment administration. However, due to the confounding factors of assessment administration changes and COVID-19, these results should be interpreted with caution and should not be directly compared to previous assessment administrations.
7.1 Impacts to Assessment Administration
The 2020–2021 school year was significantly impacted by COVID-19. Overall, participation in DLM assessments across all states was lower than what would typically be expected. This decrease was not uniform across demographic subgroups. White students made up a larger percentage of the student population in 2020–2021 than in prior years, whereas African American students, students of Hispanic ethnicity, and English learners made up a smaller percentage of the student population. There were also fewer students who were placed in the Foundational and Band 3 complexity bands, which are used to determine the starting linkage level in each subject (see Chapter 4 of this manual for a description of linkage level assignment). Further, data from the spring teacher survey indicated that students may have had less opportunity to learn, and that many students experienced difficulty with remote learning.
For a complete discussion of student performance and the potential impacts of assessment administration changes and COVID-19, see (Accessible Teaching, Learning, and Assessment Systems, 2021).
7.2 Student Participation
During spring 2021, assessments were administered to 30,895 students in 18 states Two states chose to extend their testing window through September 2021. For these states, results are included for students who completed their assessments by the close of the standard consortium testing window on July 2, 2021.. Counts of students tested in each state are displayed in Table 7.1. The assessments were administered by 14,271 educators in 9,035 schools and 3,796 school districts.
| State | Students (n) |
|---|---|
| Alaska | 137 |
| Arkansas | 2,289 |
| Delaware | 284 |
| Illinois | 2,785 |
| Iowa | 841 |
| Kansas | 882 |
| Missouri | 2,337 |
| New Hampshire | 239 |
| New Jersey | 2,765 |
| New Mexico | 75 |
| New York | 5,123 |
| North Dakota | 225 |
| Oklahoma | 1,973 |
| Pennsylvania | 4,718 |
| Rhode Island | 365 |
| Utah | 3,192 |
| West Virginia | 562 |
| Wisconsin | 2,103 |
Table 7.2 summarizes the number of students assessed in each grade and course. More than 9,000 students participated in each of the elementary (grades 3–5) and the middle school (grades 6–8) grade bands. In an effort to increase science instruction beyond the tested grades, several states promoted participation in the science assessment at all grade levels (i.e., did not restrict participation to the grade levels required for accountability purposes). In high school (grades 9–12) almost 10,700 students participated. The differences in high school grade-level participation can be traced to differing state-level policies about the grade(s) in which students are assessed.
| Grade | Students (n) |
|---|---|
| 3 | 535 |
| 4 | 4,573 |
| 5 | 4,704 |
| 6 | 859 |
| 7 | 876 |
| 8 | 8,681 |
| 9 | 2,933 |
| 10 | 1,594 |
| 11 | 5,752 |
| 12 | 302 |
| Biology | 86 |
Table 7.3 summarizes the demographic characteristics of the students who participated in the spring 2021 administration. The majority of participants were male (67%) and white (68%). About 5% of students were monitored or eligible for English learner services.
| Subgroup | n | % |
|---|---|---|
| Gender | ||
| Male | 20,682 | 66.9 |
| Female | 10,213 | 33.1 |
| Race | ||
| White | 20,923 | 67.7 |
| African American | 4,750 | 15.4 |
| Two or more races | 3,110 | 10.1 |
| Asian | 1,196 | 3.9 |
| American Indian | 696 | 2.3 |
| Native Hawaiian or Pacific Islander | 166 | 0.5 |
| Alaska Native | 54 | 0.2 |
| Hispanic ethnicity | ||
| No | 25,794 | 83.5 |
| Yes | 5,101 | 16.5 |
| English learner participation | ||
| Not EL eligible or monitored | 29,402 | 95.2 |
| EL eligible or monitored | 1,493 | 4.8 |
In addition to the spring administration, instructionally embedded science assessments are also made available for teachers to administer to students during the year. Results from the instructionally embedded science assessments do not contribute to final summative scoring but can be used to guide instructional decision-making. Table 7.4 summarizes the number of students participating in instructionally embedded testing by state. A total of 2,177 students, across 10 states, took at least one instructionally embedded science testlet during the 2020–2021 academic year.
| State | n |
|---|---|
| Arkansas | 529 |
| Delaware | 5 |
| Iowa | 117 |
| Kansas | 204 |
| Missouri | 1,226 |
| New Jersey | 1 |
| North Dakota | 51 |
| Oklahoma | 41 |
| Utah | 1 |
| Wisconsin | 2 |
Table 7.5 summarizes the number of instructionally embedded testlets taken in science. Across 10 states, students took 15,881 total testlets during the instructionally embedded window.
| Grade | n |
|---|---|
| 3 | 891 |
| 4 | 900 |
| 5 | 2,844 |
| 6 | 1,101 |
| 7 | 1,136 |
| 8 | 3,413 |
| 9 | 1,035 |
| 10 | 1,265 |
| 11 | 1,988 |
| 12 | 1,306 |
| Biology | 2 |
7.3 Student Performance
Student performance on DLM assessments is interpreted using cut points, determined during standard setting, which categorize student results into four performance levels. For a full description of the standard-setting process, see Chapter 6 of the 2015–2016 Technical Manual—Science (Dynamic Learning Maps Consortium, 2017). Additional cut points were set for grade 3 and grade 7 in 2018–2019. For a description of the cut points for those grades, see Chapter 6 of the 2018–2019 Technical Manual Update—Science (Dynamic Learning Maps Consortium, 2019). A student’s performance level is determined based on the total number of linkage levels mastered across the assessed Essential Elements (EEs).
For the spring 2021 administration, student performance was reported using the same four performance levels approved by the DLM Consortium for prior years:
- The student demonstrates Emerging understanding of and ability to apply content knowledge and skills represented by the EEs.
- The student’s understanding of and ability to apply targeted content knowledge and skills represented by the EEs is Approaching the Target.
- The student’s understanding of and ability to apply content knowledge and skills represented by the EEs is At Target. This performance level is considered to be meeting achievement expectations.
- The student demonstrates Advanced understanding of and ability to apply targeted content knowledge and skills represented by the EEs.
7.3.1 Overall Performance
Table 7.6 reports the percentage of students achieving at each performance level from the spring 2021 administration for science. The spring 2021 results were fairly consistent with performance in prior years, with the majority of students achieving at either the Emerging or Approaching the Target performance levels. At the elementary level, the percentage of students who achieved at the At Target or Advanced levels ranged from approximately 12% to 15%; in middle school the range was 16% to 20%; and in high school and end-of-instruction biology, the percentages ranged from 6% to 26%.
| Grade | Emerging (%) | Approaching (%) | Target (%) | Advanced (%) | Target+ Advanced (%) |
|---|---|---|---|---|---|
| 3 (n = 535) | 66.0 | 21.1 | 7.1 | 5.8 | 12.9 |
| 4 (n = 4,573) | 64.2 | 21.3 | 10.5 | 4.0 | 14.5 |
| 5 (n = 4,704) | 67.5 | 20.2 | 11.5 | 0.8 | 12.2 |
| 6 (n = 859) | 63.0 | 20.8 | 12.9 | 3.3 | 16.2 |
| 7 (n = 876) | 61.5 | 22.4 | 13.1 | 3.0 | 16.1 |
| 8 (n = 8,681) | 56.2 | 24.2 | 17.6 | 2.0 | 19.6 |
| 9 (n = 2,933) | 56.3 | 25.5 | 13.7 | 4.6 | 18.2 |
| 10 (n = 1,594) | 62.0 | 26.8 | 9.2 | 2.0 | 11.2 |
| 11 (n = 5,752) | 54.8 | 29.2 | 13.3 | 2.8 | 16.1 |
| 12 (n = 302) | 74.5 | 19.2 | 6.0 | 0.3 | 6.3 |
| Biology (n = 86) | 58.1 | 16.3 | 19.8 | 5.8 | 25.6 |
7.3.2 Subgroup Performance
Data collection for DLM assessments includes demographic data on gender, race, ethnicity, and English learner status. Table 7.7 summarizes the disaggregated frequency distributions for science, collapsed across all assessed grade levels. Although state education agencies each have their own rules for minimum student counts needed to support public reporting of results, small counts are not suppressed here because results are aggregated across states and individual students cannot be identified.
|
Emerging
|
Approaching
|
Target
|
Advanced
|
|||||
|---|---|---|---|---|---|---|---|---|
| Subgroup | n | % | n | % | n | % | n | % |
| Gender | ||||||||
| Male | 12,277 | 59.4 | 4,905 | 23.7 | 2,891 | 14.0 | 609 | 2.9 |
| Female | 6,213 | 60.8 | 2,528 | 24.8 | 1,268 | 12.4 | 204 | 2.0 |
| Race | ||||||||
| White | 12,354 | 59.0 | 5,118 | 24.5 | 2,889 | 13.8 | 562 | 2.7 |
| African American | 2,877 | 60.6 | 1,115 | 23.5 | 625 | 13.2 | 133 | 2.8 |
| Two or more races | 1,921 | 61.8 | 726 | 23.3 | 396 | 12.7 | 67 | 2.2 |
| Asian | 833 | 69.6 | 236 | 19.7 | 105 | 8.8 | 22 | 1.8 |
| American Indian | 367 | 52.7 | 190 | 27.3 | 116 | 16.7 | 23 | 3.3 |
| Native Hawaiian or Pacific Islander | 105 | 63.3 | 36 | 21.7 | 20 | 12.0 | 5 | 3.0 |
| Alaska Native | 33 | 61.1 | 12 | 22.2 | 8 | 14.8 | 1 | 1.9 |
| Hispanic ethnicity | ||||||||
| No | 15,314 | 59.4 | 6,272 | 24.3 | 3,530 | 13.7 | 678 | 2.6 |
| Yes | 3,176 | 62.3 | 1,161 | 22.8 | 629 | 12.3 | 135 | 2.6 |
| English learner participation | ||||||||
| Not EL eligible or monitored | 17,605 | 59.9 | 7,068 | 24.0 | 3,967 | 13.5 | 762 | 2.6 |
| EL eligible or monitored | 885 | 59.3 | 365 | 24.4 | 192 | 12.9 | 51 | 3.4 |
7.3.3 Linkage Level Mastery
As described earlier in the chapter, overall performance in each subject is calculated based on the number of linkage levels mastered across all EEs. Results indicate the highest linkage level the student mastered for each EE. The linkage levels are (in order): Initial, Precursor, and Target. A student can be a master of zero, one, two, or all three linkage levels, within the order constraints. For example, if a student masters the Precursor level, they also master the Initial linkage level. This section summarizes the distribution of students by highest linkage level mastered across all EEs. For each student, the highest linkage level mastered across all tested EEs was calculated. Then, for each grade, the number of students with each linkage level as their highest mastered linkage level across all EEs was summed and then divided by the total number of students who tested in the grade. This resulted in the proportion of students for whom each level was the highest level mastered.
Table 7.8 reports the percentage of students who mastered each linkage level as the highest linkage level across all EEs for each grade. For example, across all third-grade EEs, the Initial level was the highest level that students mastered 43% of the time. The percentage of students who mastered as high as the Target linkage level ranged from approximately 21% in grade 12 to 50% in grade 8.
|
Linkage Level
|
||||
|---|---|---|---|---|
| Grade | No evidence (%) | Initial (%) | Precursor (%) | Target (%) |
| 3 (n = 535) | 16.1 | 42.8 | 11.8 | 29.3 |
| 4 (n = 4,573) | 5.6 | 40.0 | 13.8 | 40.6 |
| 5 (n = 4,704) | 5.1 | 40.2 | 13.2 | 41.5 |
| 6 (n = 859) | 8.4 | 33.3 | 18.0 | 40.3 |
| 7 (n = 876) | 7.8 | 30.7 | 20.7 | 40.9 |
| 8 (n = 8,681) | 4.9 | 27.3 | 17.5 | 50.4 |
| 9 (n = 2,933) | 7.1 | 29.0 | 28.0 | 35.9 |
| 10 (n = 1,594) | 6.1 | 32.4 | 33.1 | 28.3 |
| 11 (n = 5,752) | 4.6 | 28.7 | 30.5 | 36.1 |
| 12 (n = 302) | 21.5 | 38.1 | 19.5 | 20.9 |
| Biology (n = 86) | 5.8 | 34.9 | 22.1 | 37.2 |
7.4 Data Files
Data files were made available to DLM state education agencies following the spring 2021 administration. Similar to prior years, the General Research File (GRF) contained student results, including each student’s highest linkage level mastered for each EE and final performance level for the subject for all students who completed any testlets. In addition to the GRF, the DLM Consortium delivered several supplemental files. Consistent with prior years, the special circumstances file provided information about which students and EEs were affected by extenuating circumstances (e.g., chronic absences), as defined by each state. Three new special circumstance codes were available in 2020–2021: 1. Student could not test due to COVID-19; 2. Teacher administered the assessment remotely; and 3. Non-teacher administered. State education agencies also received a supplemental file to identify exited students. The exited students file included all students who exited at any point during the academic year. In the event of observed incidents during assessment delivery, state education agencies are provided with an incident file describing students impacted. For a description of incidents observed during the 2020–2021 administration, see Chapter 4 of this manual.
Consistent with prior delivery cycles, state partners were provided with a two-week review window following data file delivery to review the files and invalidate student records in the GRF. Decisions about whether to invalidate student records are informed by individual state policy. If changes were made to the GRF, state partners submitted final GRFs via Educator Portal. The final GRF was used to generate score reports.
In addition to the GRF and its supplemental files, states were provided with two additional de-identified data files: a teacher survey data file and a test administration observations data file. The teacher survey file provided state-specific teacher survey responses, with all identifying information about the student and educator removed. The test administration observations file provided test administration observation responses with any identifying information removed. For more information regarding teacher survey content and response rates, see Chapter 4 of this manual. For more information about test administration observation results, see Chapter 9 of this manual.
7.5 Score Reports
The DLM Consortium provides assessment results to all member states to report to parents/guardians, educators, and state and local education agencies. Individual Student Score Reports summarized student performance on the assessment by subject. Several aggregated reports were provided to state and local education agencies, including reports for the classroom, school, district, and state. No changes were made to the structure of aggregated reports during spring 2021. Changes to the Individual Student Score Reports are summarized below. For a complete description of score reports, including aggregated reports, see Chapter 7 of the 2014–2015 Technical Manual—Year-End Model (Dynamic Learning Maps Consortium, 2016).
7.5.1 Individual Student Score Reports
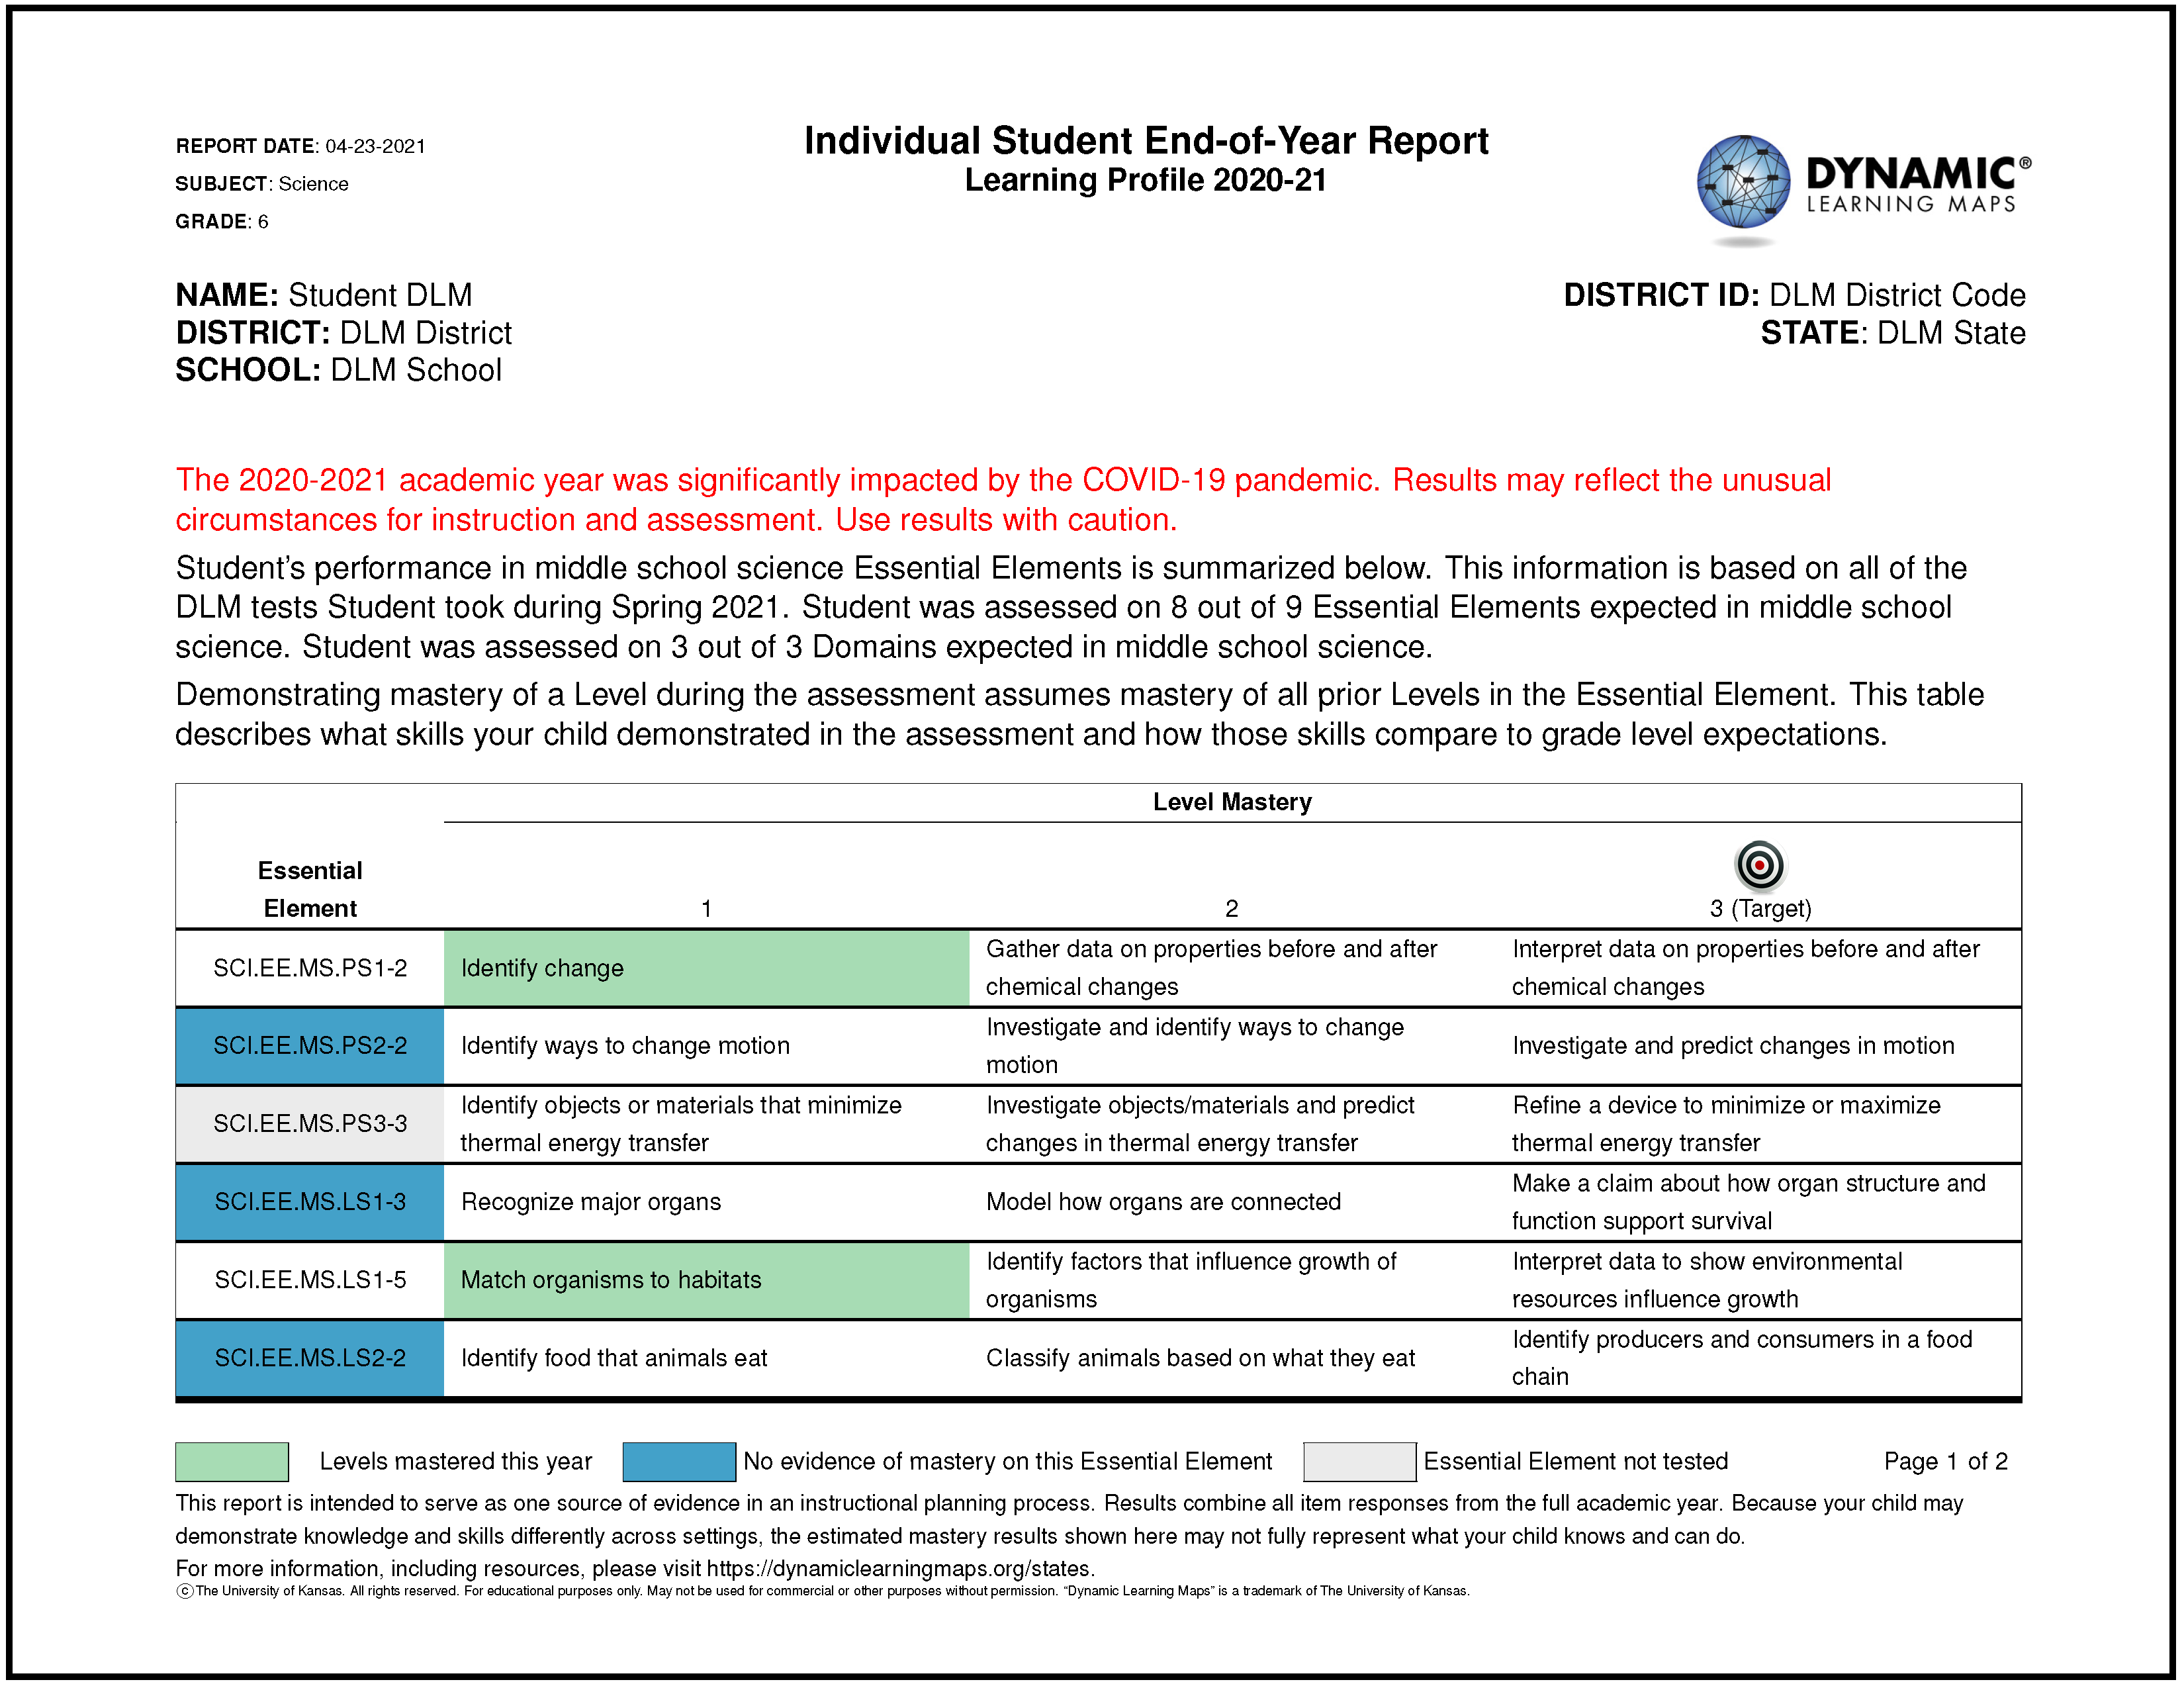
Individual Student Score Reports included a Performance Profile section, which describes student performance in the subject overall. In 2021, a Learning Profile section was added to the reports, which provides detailed reporting of student mastery of individual skills. The Learning Profile section was added due to changes in the year-end blueprint in 2019–2020. A cautionary statement was added to the 2020–2021 Performance Profile and Learning Profile, which indicated that the 2020–2021 academic year was significantly impacted by the COVID-19 pandemic, and mastery results may have reflected the unusual circumstances for instruction and assessment. For more information on validity considerations and scoring and reporting in flexible scenarios, see (Clark et al., 2021).
EEs were reordered in the table in the Learning Profile to match blueprint order, and the hyperlink for the DLM website’s font was increased and moved to the footer before the copyright statement.
A sample Performance Profile and a sample Learning Profile reflecting the 2020–2021 changes are provided in Figure 7.1 and Figure 7.2.
Figure 7.1: Example Page of the Performance Profile for 2020–2021.
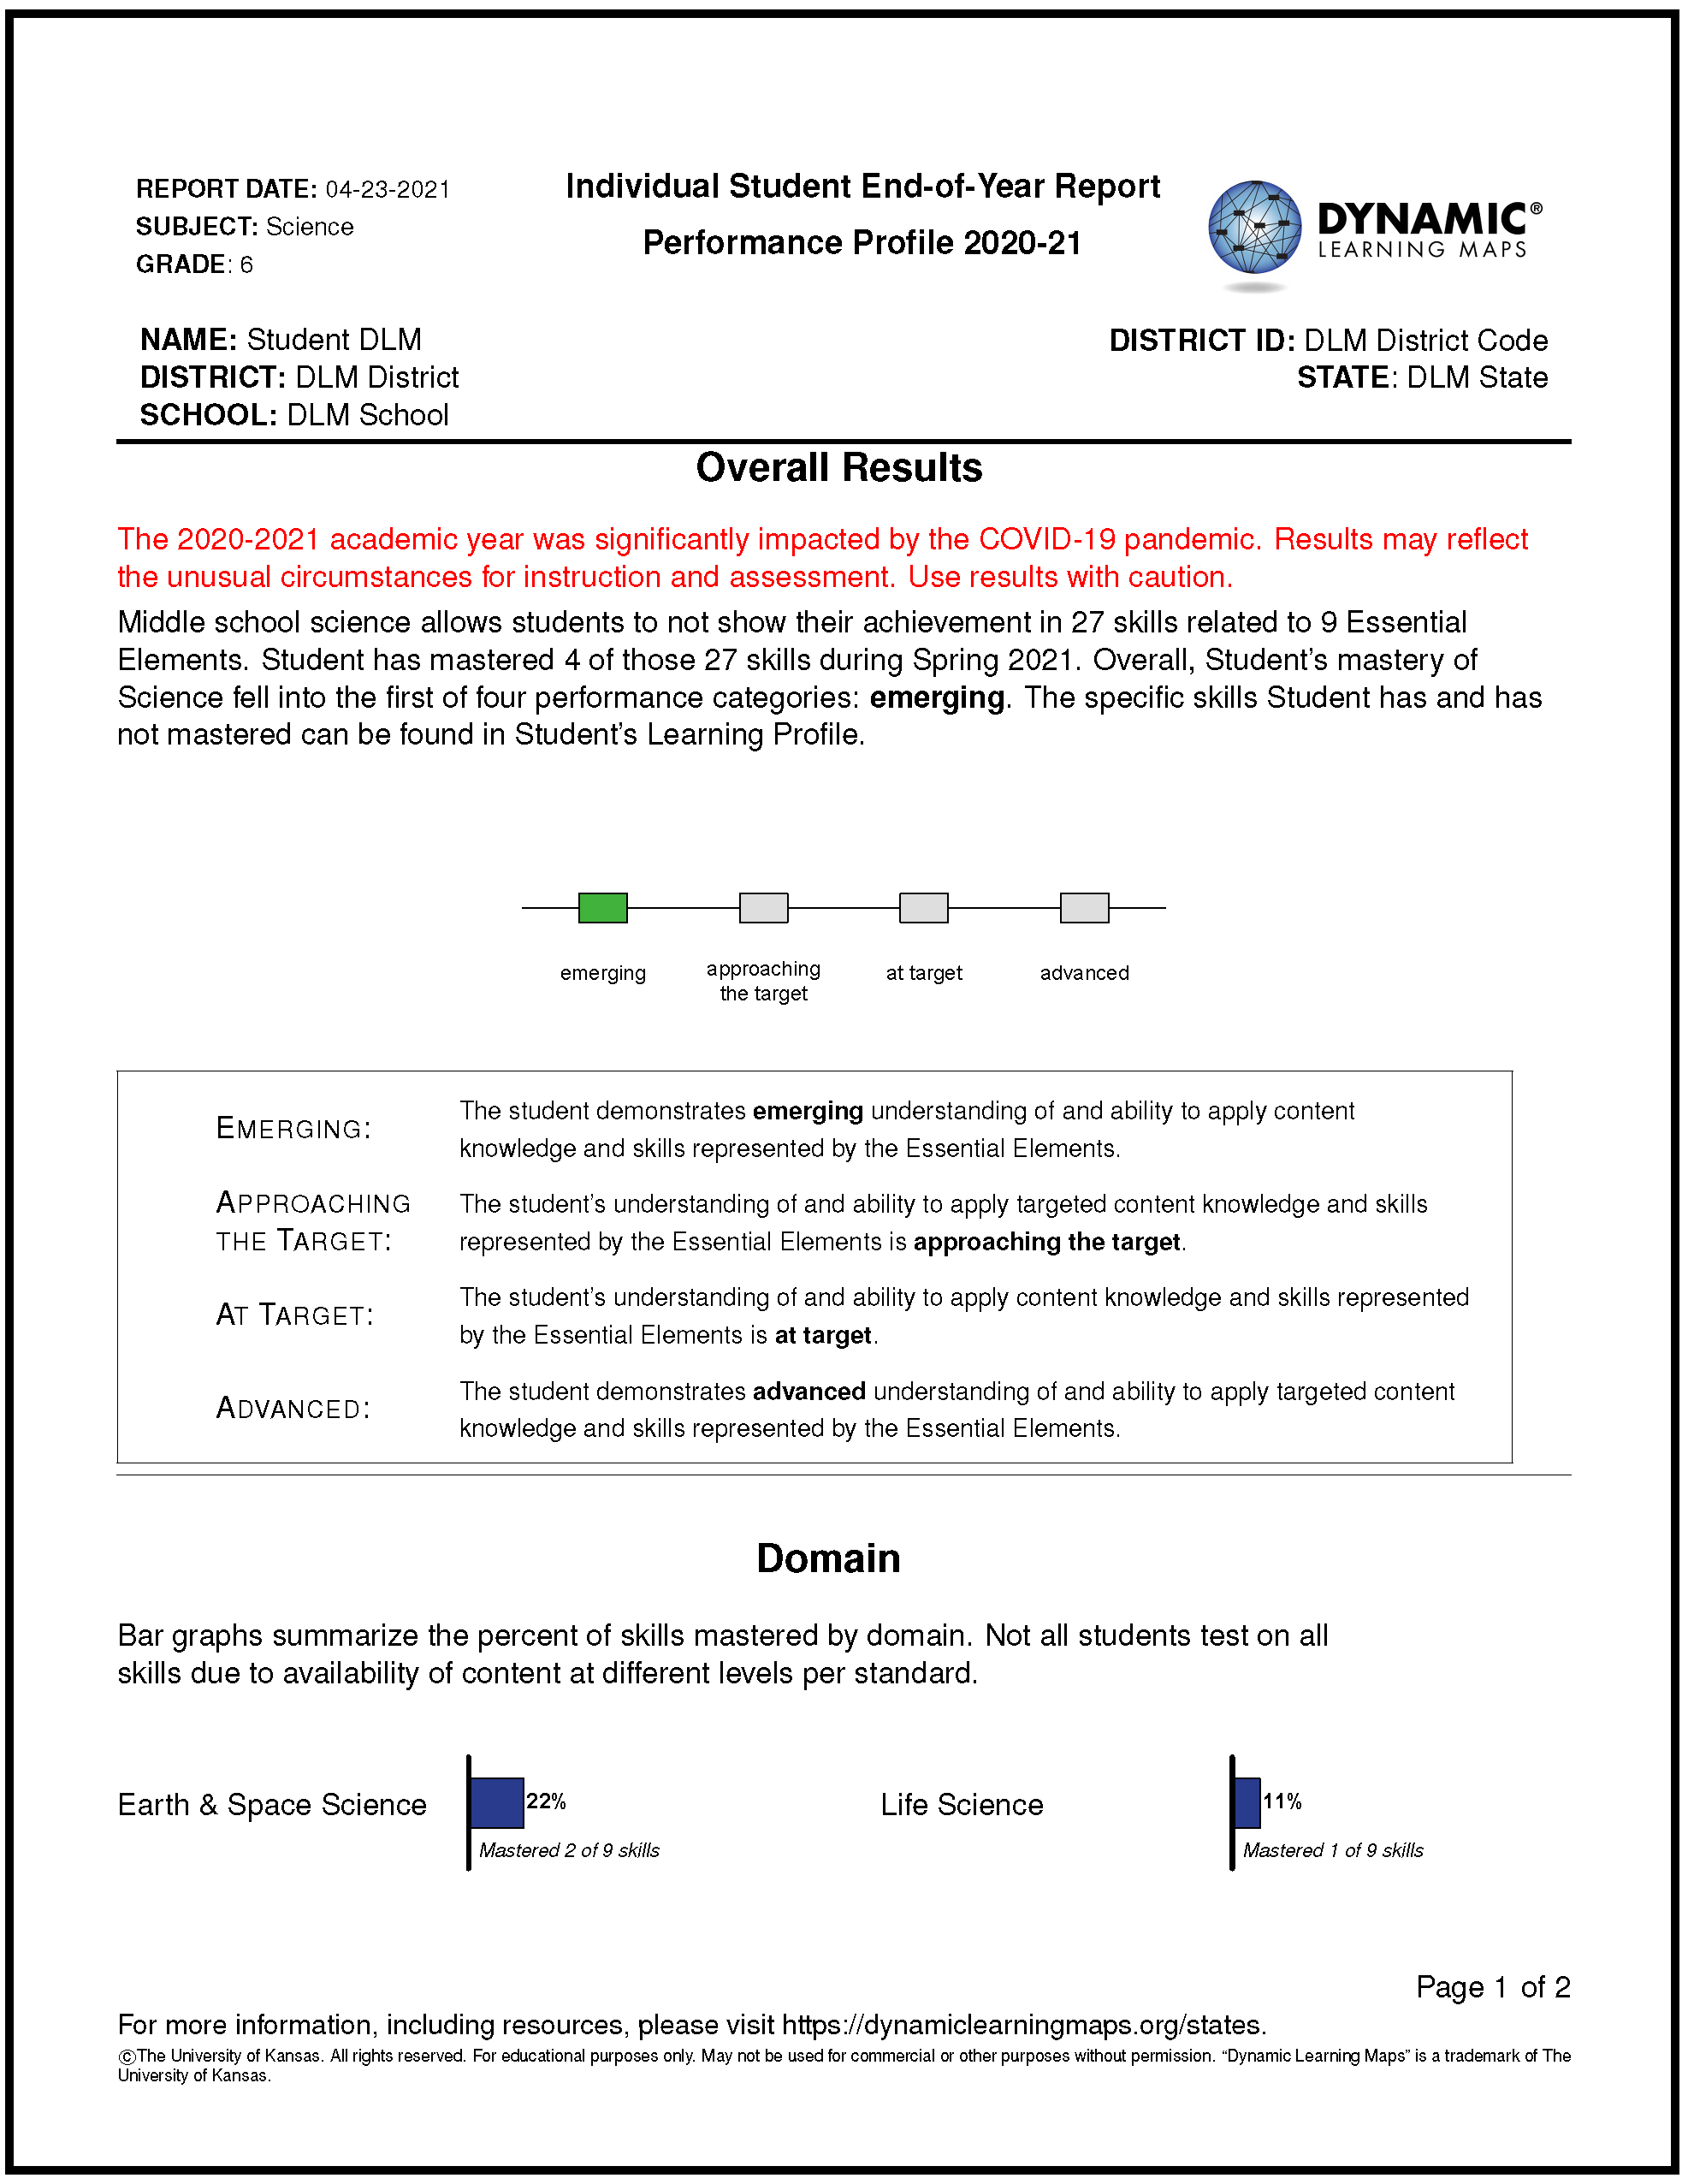
Figure 7.2: Example Page of the Learning Profile for 2020–2021.
7.6 Quality Control Procedures for Data Files and Score Reports
Changes to the quality control procedures were made only to the extent of accommodating the revised score reports for spring 2021 (i.e., checking to be sure changes were correctly and consistently applied). For a complete description of quality control procedures, see Chapter 7 in the 2015–2016 Technical Manual—Science (Dynamic Learning Maps Consortium, 2017).
7.7 Conclusion
Following the spring 2021 administration, six data files were delivered to state partners: GRF, special circumstance code file, exited students file, incident file, teacher survey data file, and test administration observations file. An incident file was delivered describing the impact of one reported incident. Overall, between 6% and 26% of students achieved at the At Target or Advanced levels across all grades and subjects. However, these results should be interpreted with caution due to the confounding factors of assessment administration changes and COVID-19. Lastly, minor changes were made to score reports to aid in interpretation.