5 Modeling
Chapter 5 of the Dynamic Learning Maps® (DLM®) Alternate Assessment System 2015–2016 Technical Manual—Science (Dynamic Learning Maps Consortium, 2017) describes the basic psychometric model that underlies the DLM assessment system and the process used to estimate item and student parameters from student assessment data. This chapter provides a high-level summary of the model used to calibrate and score assessments, along with a summary of updated modeling evidence from the 2020–2021 administration year.
For a complete description of the psychometric model used to calibrate and score the DLM assessments, including the psychometric background, the structure of the assessment system, suitability for diagnostic modeling, and a detailed summary of the procedures used to calibrate and score DLM assessments, see the 2015–2016 Technical Manual—Science (Dynamic Learning Maps Consortium, 2017).
5.1 Overview of the Psychometric Model
Learning map models, which are networks of sequenced learning targets, are at the core of the DLM assessments in science. Because of the underlying map structure and the goal of providing more fine-grained information beyond a single raw or scale score value when reporting student results, the assessment system provides a profile of skill mastery to summarize student performance. This profile is created using latent class analysis, a form of diagnostic classification modeling, to provide information about student mastery of multiple skills measured by the assessment. Results are reported for each alternate content standard, called an Essential Element (EE), at the three levels of complexity for which assessments are available: Initial, Precursor, and Target.
Simultaneous calibration of all linkage levels within an EE is not currently possible because of the administration design, in which overlapping data from students taking testlets at multiple levels within an EE is uncommon. Instead, each linkage level was calibrated separately for each EE using separate latent class analyses. Also, because items were developed to meet a precise cognitive specification, all master and non-master probability parameters for items measuring a linkage level were assumed to be equal. That is, all items were assumed to be fungible, or exchangeable, within a linkage level.
A description of the DLM scoring model for the 2020–2021 administration follows. Using latent class analysis, a probability of mastery was calculated on a scale from 0 to 1 for each linkage level within each EE. Each linkage level within each EE was considered the latent variable to be measured. Students were then classified into one of two classes for each linkage level of each EE: master or non-master. As described in Chapter 6 of the 2015–2016 Technical Manual—Science (Dynamic Learning Maps Consortium, 2017), a posterior probability of at least .80 was required for mastery classification. Consistent with the assumption of item fungibility, a single set of probabilities of masters and non-masters providing a correct response was estimated for all items within a linkage level. Finally, a structural parameter, which is the proportion of masters for the linkage level (i.e., the analogous map parameter), was also estimated. In total, three parameters per linkage level are specified in the DLM scoring model: a fungible probability for non-masters, a fungible probability for masters, and the proportion of masters.
Following calibration, students’ results for each linkage level were combined to determine the highest linkage level mastered for each EE. Although the connections between linkage levels were not modeled empirically, they were used in the scoring procedures. In particular, if the latent class analysis determined a student had mastered a given linkage level within an EE, then the student was assumed to have mastered all lower levels within that EE.
In addition to the calculated posterior probability of mastery, students could be assigned mastery of linkage levels within an EE in two other ways: correctly answering 80% of all items administered at the linkage level or through the two-down scoring rule. The two-down scoring rule was implemented to guard against students assessed at the highest linkage levels being overly penalized for incorrect responses. When a student did not demonstrate mastery of the assessed linkage level, mastery was assigned at two linkage levels below the level that was assessed. For more information, see the Mastery Assignment section.
5.2 Calibrated Parameters
As stated in the previous section, the comparable item parameters for diagnostic assessments are the conditional probabilities of masters and non-masters providing a correct response to the item. Because of the assumption of fungibility, parameters are calculated for each of the 102 linkage levels in science (3 linkage levels \(\times\) 34 EEs). Parameters include a conditional probability of non-masters providing a correct response and a conditional probability of masters providing a correct response. Across all linkage levels, the conditional probability that masters will provide a correct response is generally expected to be high, while it is expected to be low for non-masters. In addition to the item parameters, the psychometric model also includes a structural parameter, which defines the base rate of mastery for each linkage level. A summary of the operational parameters used to score the 2020–2021 assessment is provided in the following sections.
5.2.1 Probability of Masters Providing Correct Response
When items measuring each linkage level function as expected, students who have mastered the linkage level have a high probability of providing a correct response to items measuring the linkage level. Instances where masters have a low probability of providing correct responses may indicate that the linkage level does not measure what it is intended to measure, or that students who have mastered the content select a response other than the key. These instances may result in students who have mastered the content providing incorrect responses and being incorrectly classified as non-masters. This outcome has implications for the validity of inferences that can be made from results and for teachers using results to inform instructional planning in the subsequent year.
Using the 2020–2021 operational calibration, Figure 5.1 depicts the conditional probability of masters providing a correct response to items measuring each of the 102 linkage levels. Because the point of maximum uncertainty is .50, masters should have a greater than 50% chance of providing a correct response. The results in Figure 5.1 demonstrate that all linkage levels (n = 102, > 99%) performed as expected. Additionally, 96% of linkage levels (n = 98) had a conditional probability of masters providing a correct response over .60. No linkage levels (n = 0, < 1%) had a conditional probability of masters providing a correct response less than .40. Thus, all linkage levels performed consistent with expectations for masters of the linkage levels.
Figure 5.1: Probability of Masters Providing a Correct Response to Items Measuring Each Linkage Level
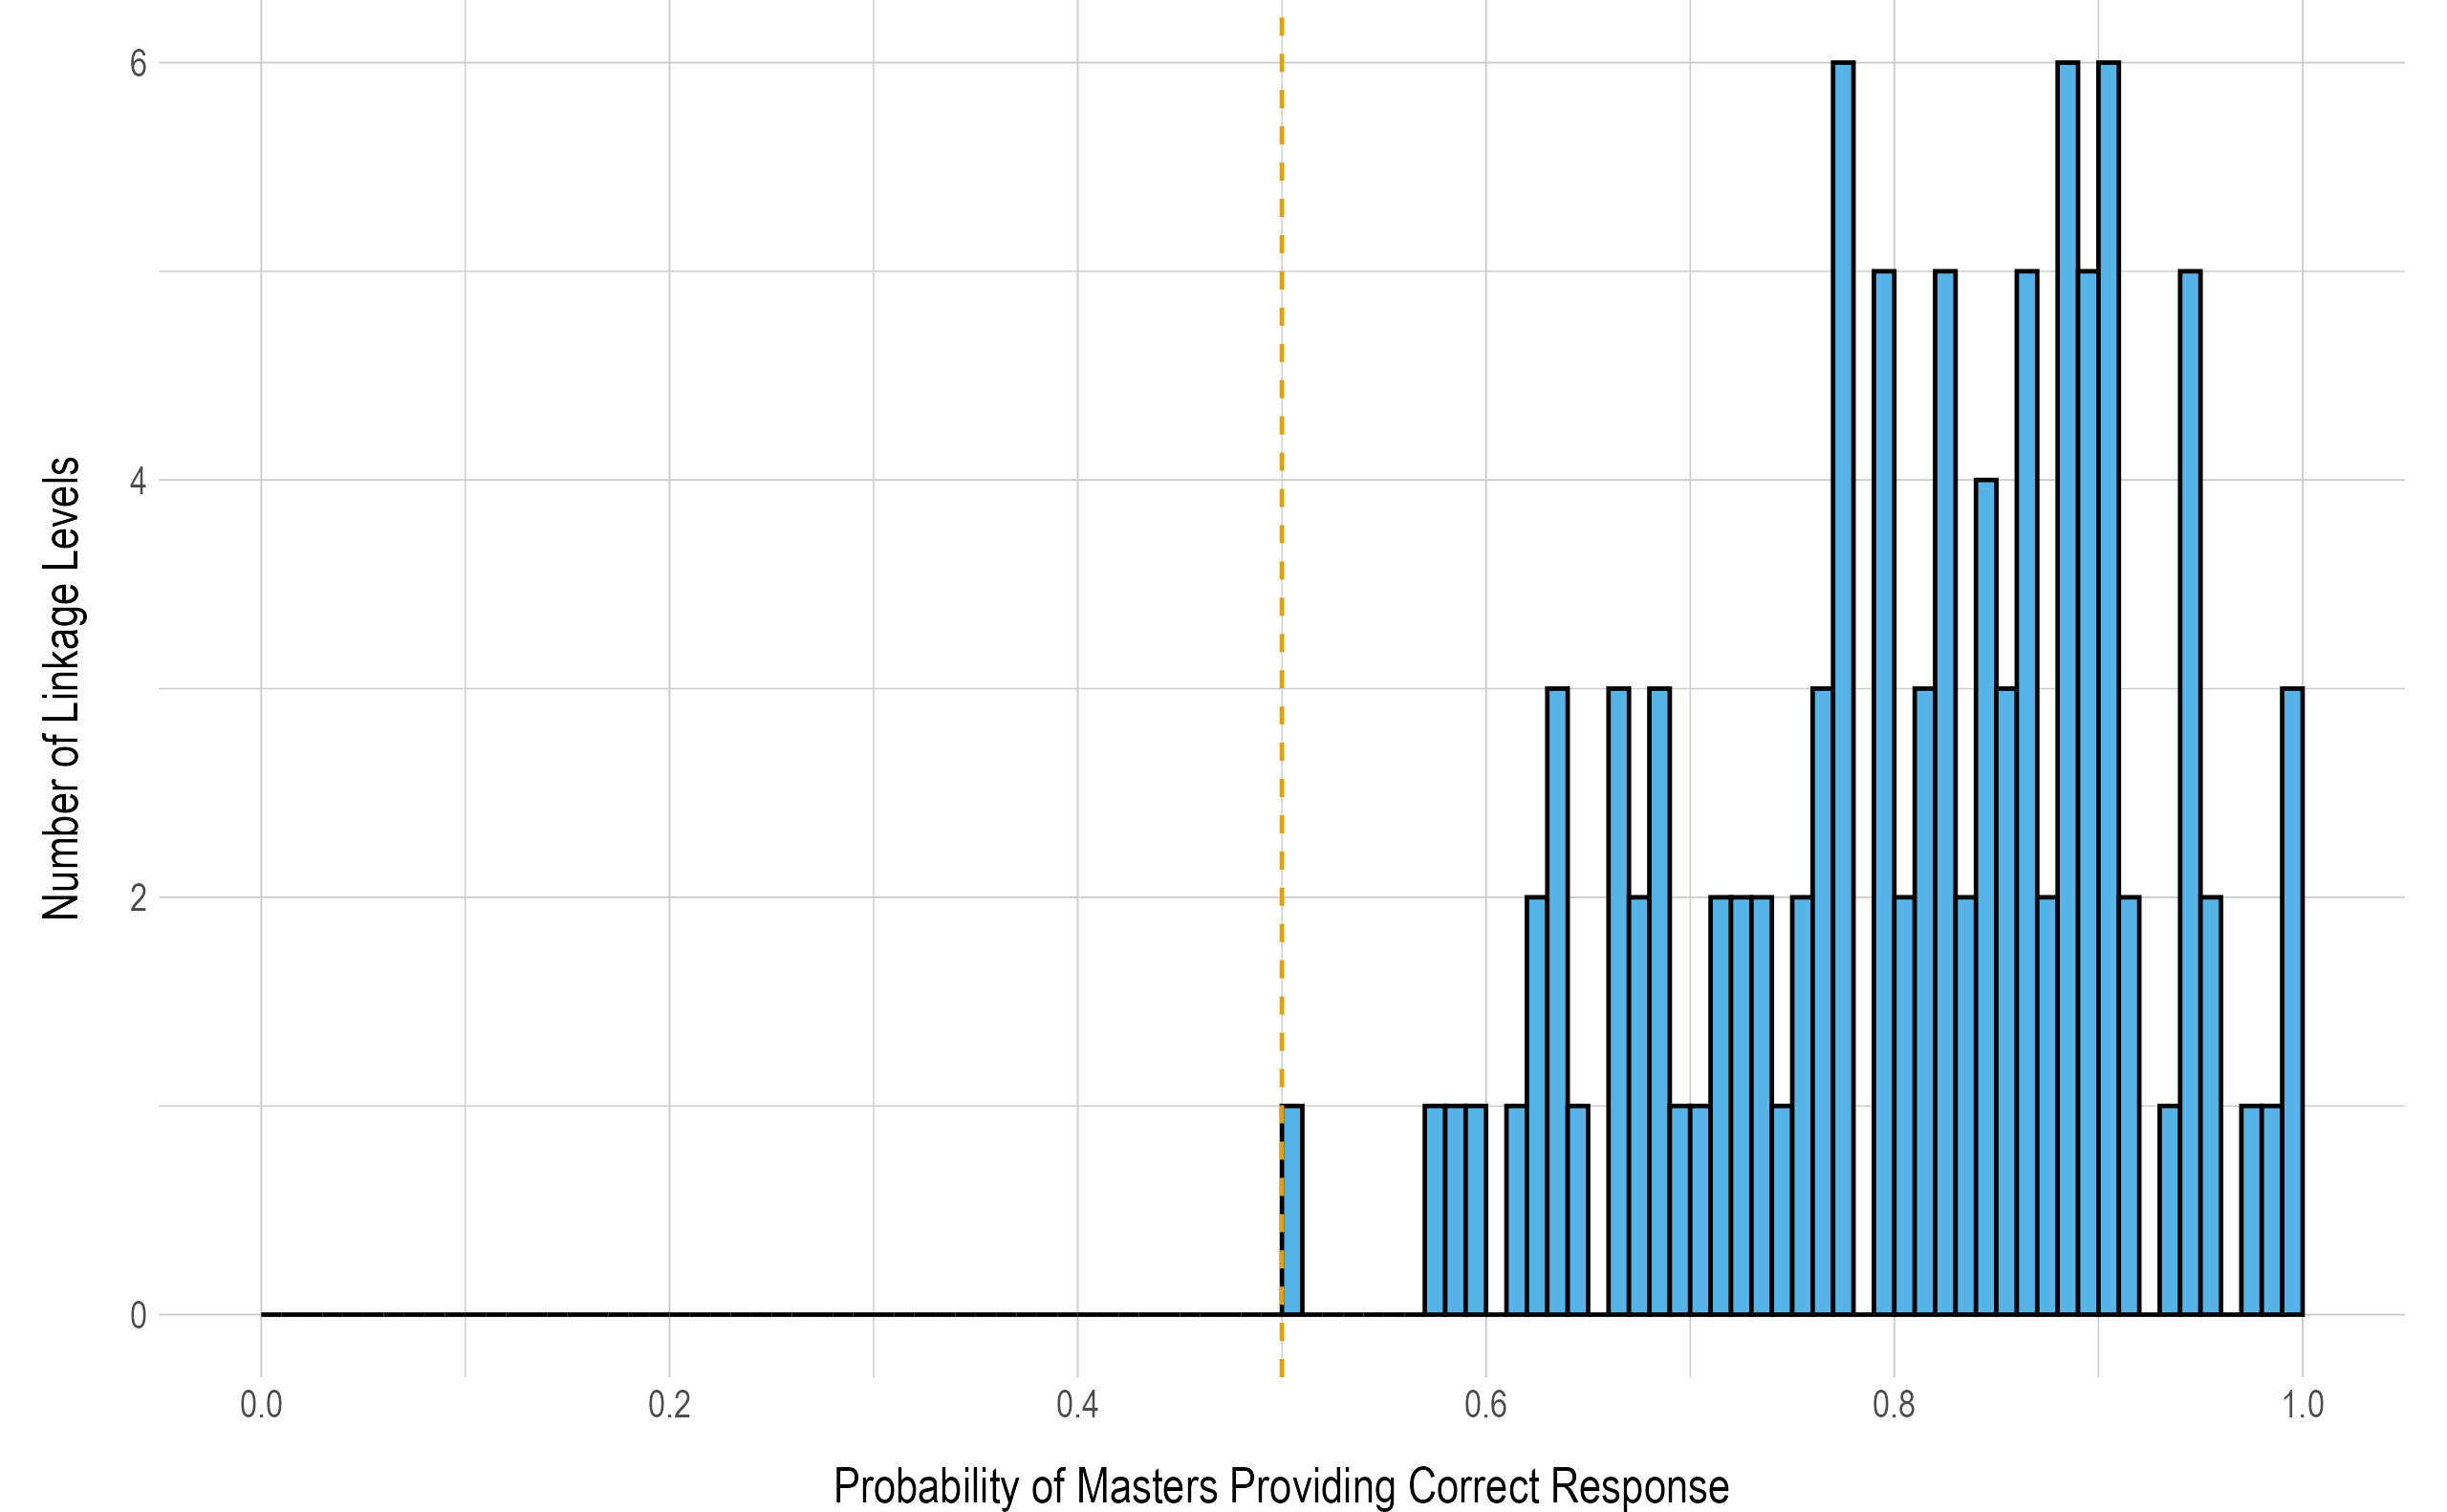
Note. Histogram bins are shown in increments of .01. Reference line indicates .50.
5.2.2 Probability of Non-Masters Providing Correct Response
When items measuring each linkage level function as expected, non-masters of the linkage level have a low probability of providing a correct response to items measuring the linkage level. Instances where non-masters have a high probability of providing correct responses may indicate that the linkage level does not measure what it is intended to measure, or that the correct answers to items measuring the level are easily guessed. These instances may result in students who have not mastered the content providing correct responses and being incorrectly classified as masters. This outcome has implications for the validity of inferences that can be made from results and for teachers using results to inform instructional planning in the subsequent year.
Figure 5.2 summarizes the probability of non-masters providing correct responses to items measuring each of the 102 linkage levels. There is greater variation in the probability of non-masters providing a correct response to items measuring each linkage level than was observed for masters, as shown in Figure 5.2. While the majority linkage levels (n = 84, 82%) performed as expected, non-masters sometimes had a greater than chance (> .50) likelihood of providing a correct response to items measuring the linkage level. Although most linkage levels (n = 60, 59%) have a conditional probability of non-masters providing a correct response less than .40, 4 (4%) have a conditional probability for non-masters providing a correct response greater than .60, indicating there are some linkage levels where non-masters are more likely than not to provide a correct response. This may indicate the items (and linkage level as a whole, since the item parameters are shared) were easily guessable or did not discriminate well between the two groups of students. All of the 4 linkage levels with a conditional probability for non-masters providing a correct response greater than .60 were at the Target linkage level.
Figure 5.2: Probability of Non-Masters Providing a Correct Response to Items Measuring Each Linkage Level
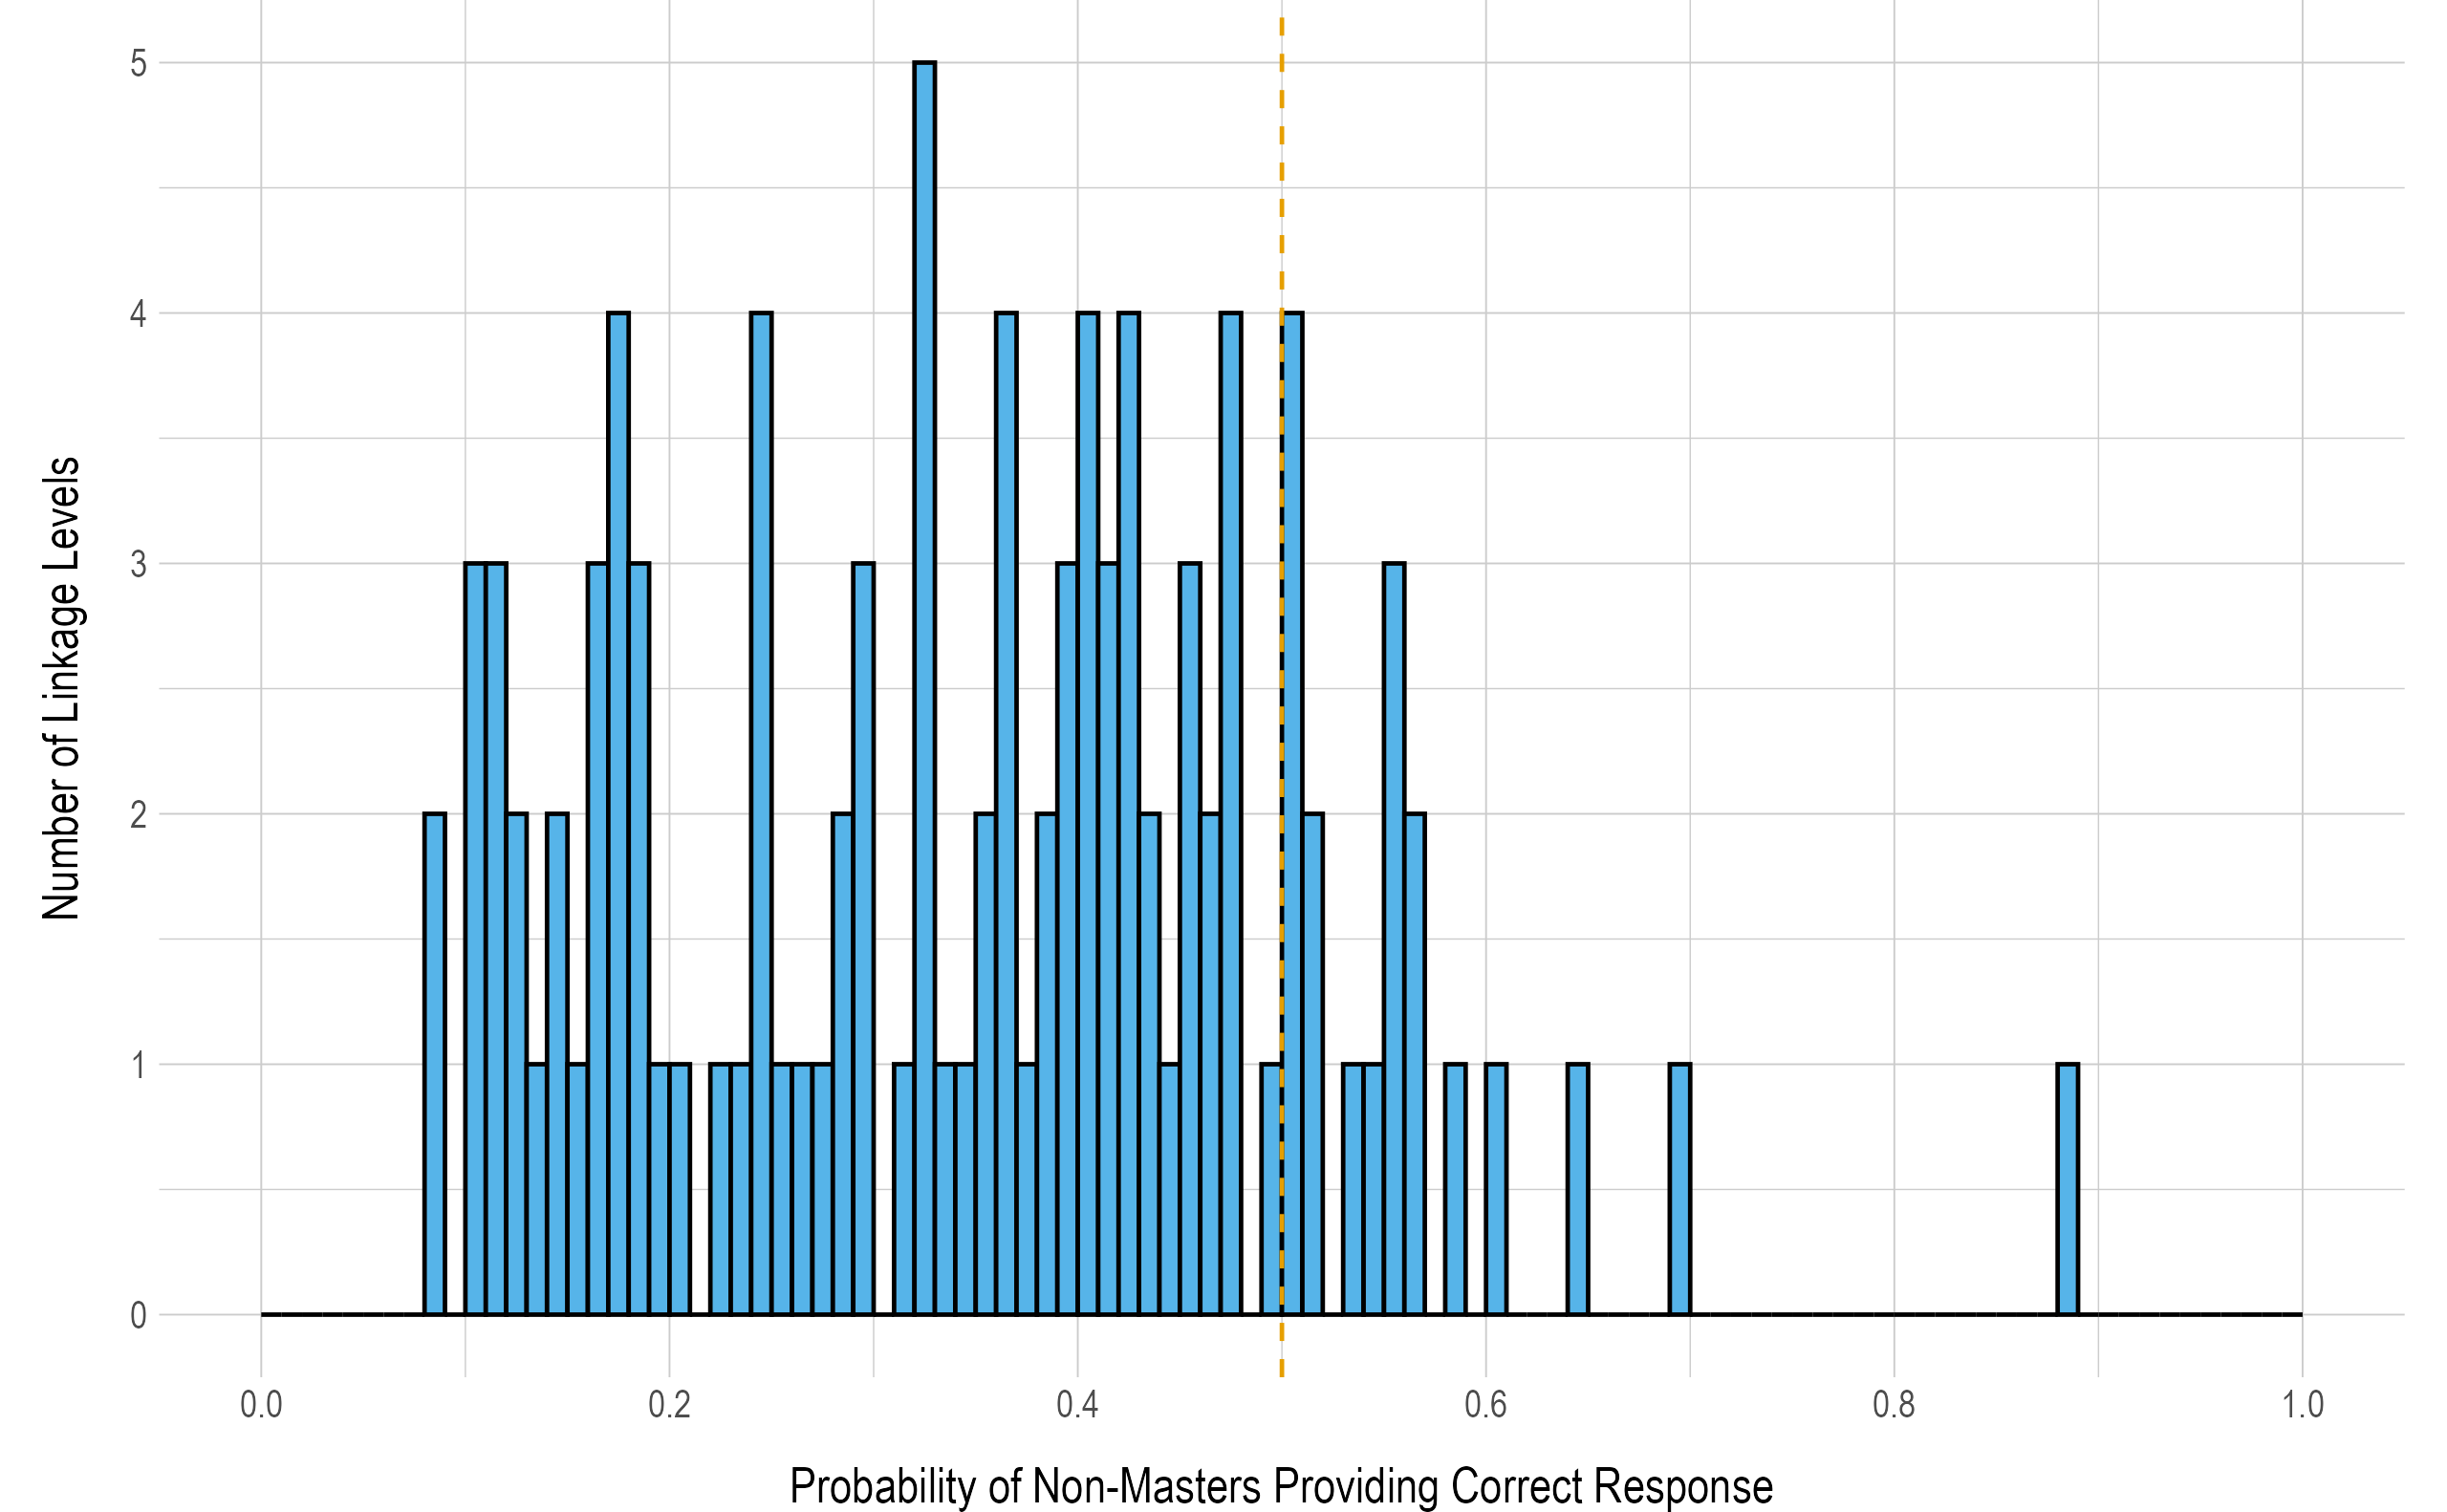
Note. Histogram bins are in increments of .01. Reference line indicates .50.
5.2.3 Item Discrimination
The discrimination of a linkage level represents how well the items are able to differentiate masters and non-masters. For diagnostic models, this is assessed by comparing the conditional probabilities of masters and non-masters providing a correct response. Linkage levels that are highly discriminating will have a large difference between the conditional probabilities, with a maximum value of 1.00 (i.e., masters have a 100% chance of providing a correct response and non-masters a 0% chance). Figure 5.3 shows the distribution of linkage level discrimination values. Overall, 64% of linkage levels (n = 65) have a discrimination greater than .40, indicating a large difference between the conditional probabilities (e.g., .75 to .35, .90 to .50, etc.). However, there were 4 linkage levels (4%) with a discrimination of less than .10, indicating that masters and non-masters tend to perform similarly on items measuring these linkage levels. All of the 4 linkage levels with a discrimination of less than .10 were at the Target linkage level.
Figure 5.3: Difference Between Masters’ and Non-Masters’ Probability of Providing a Correct Response to Items Measuring Each Linkage Level
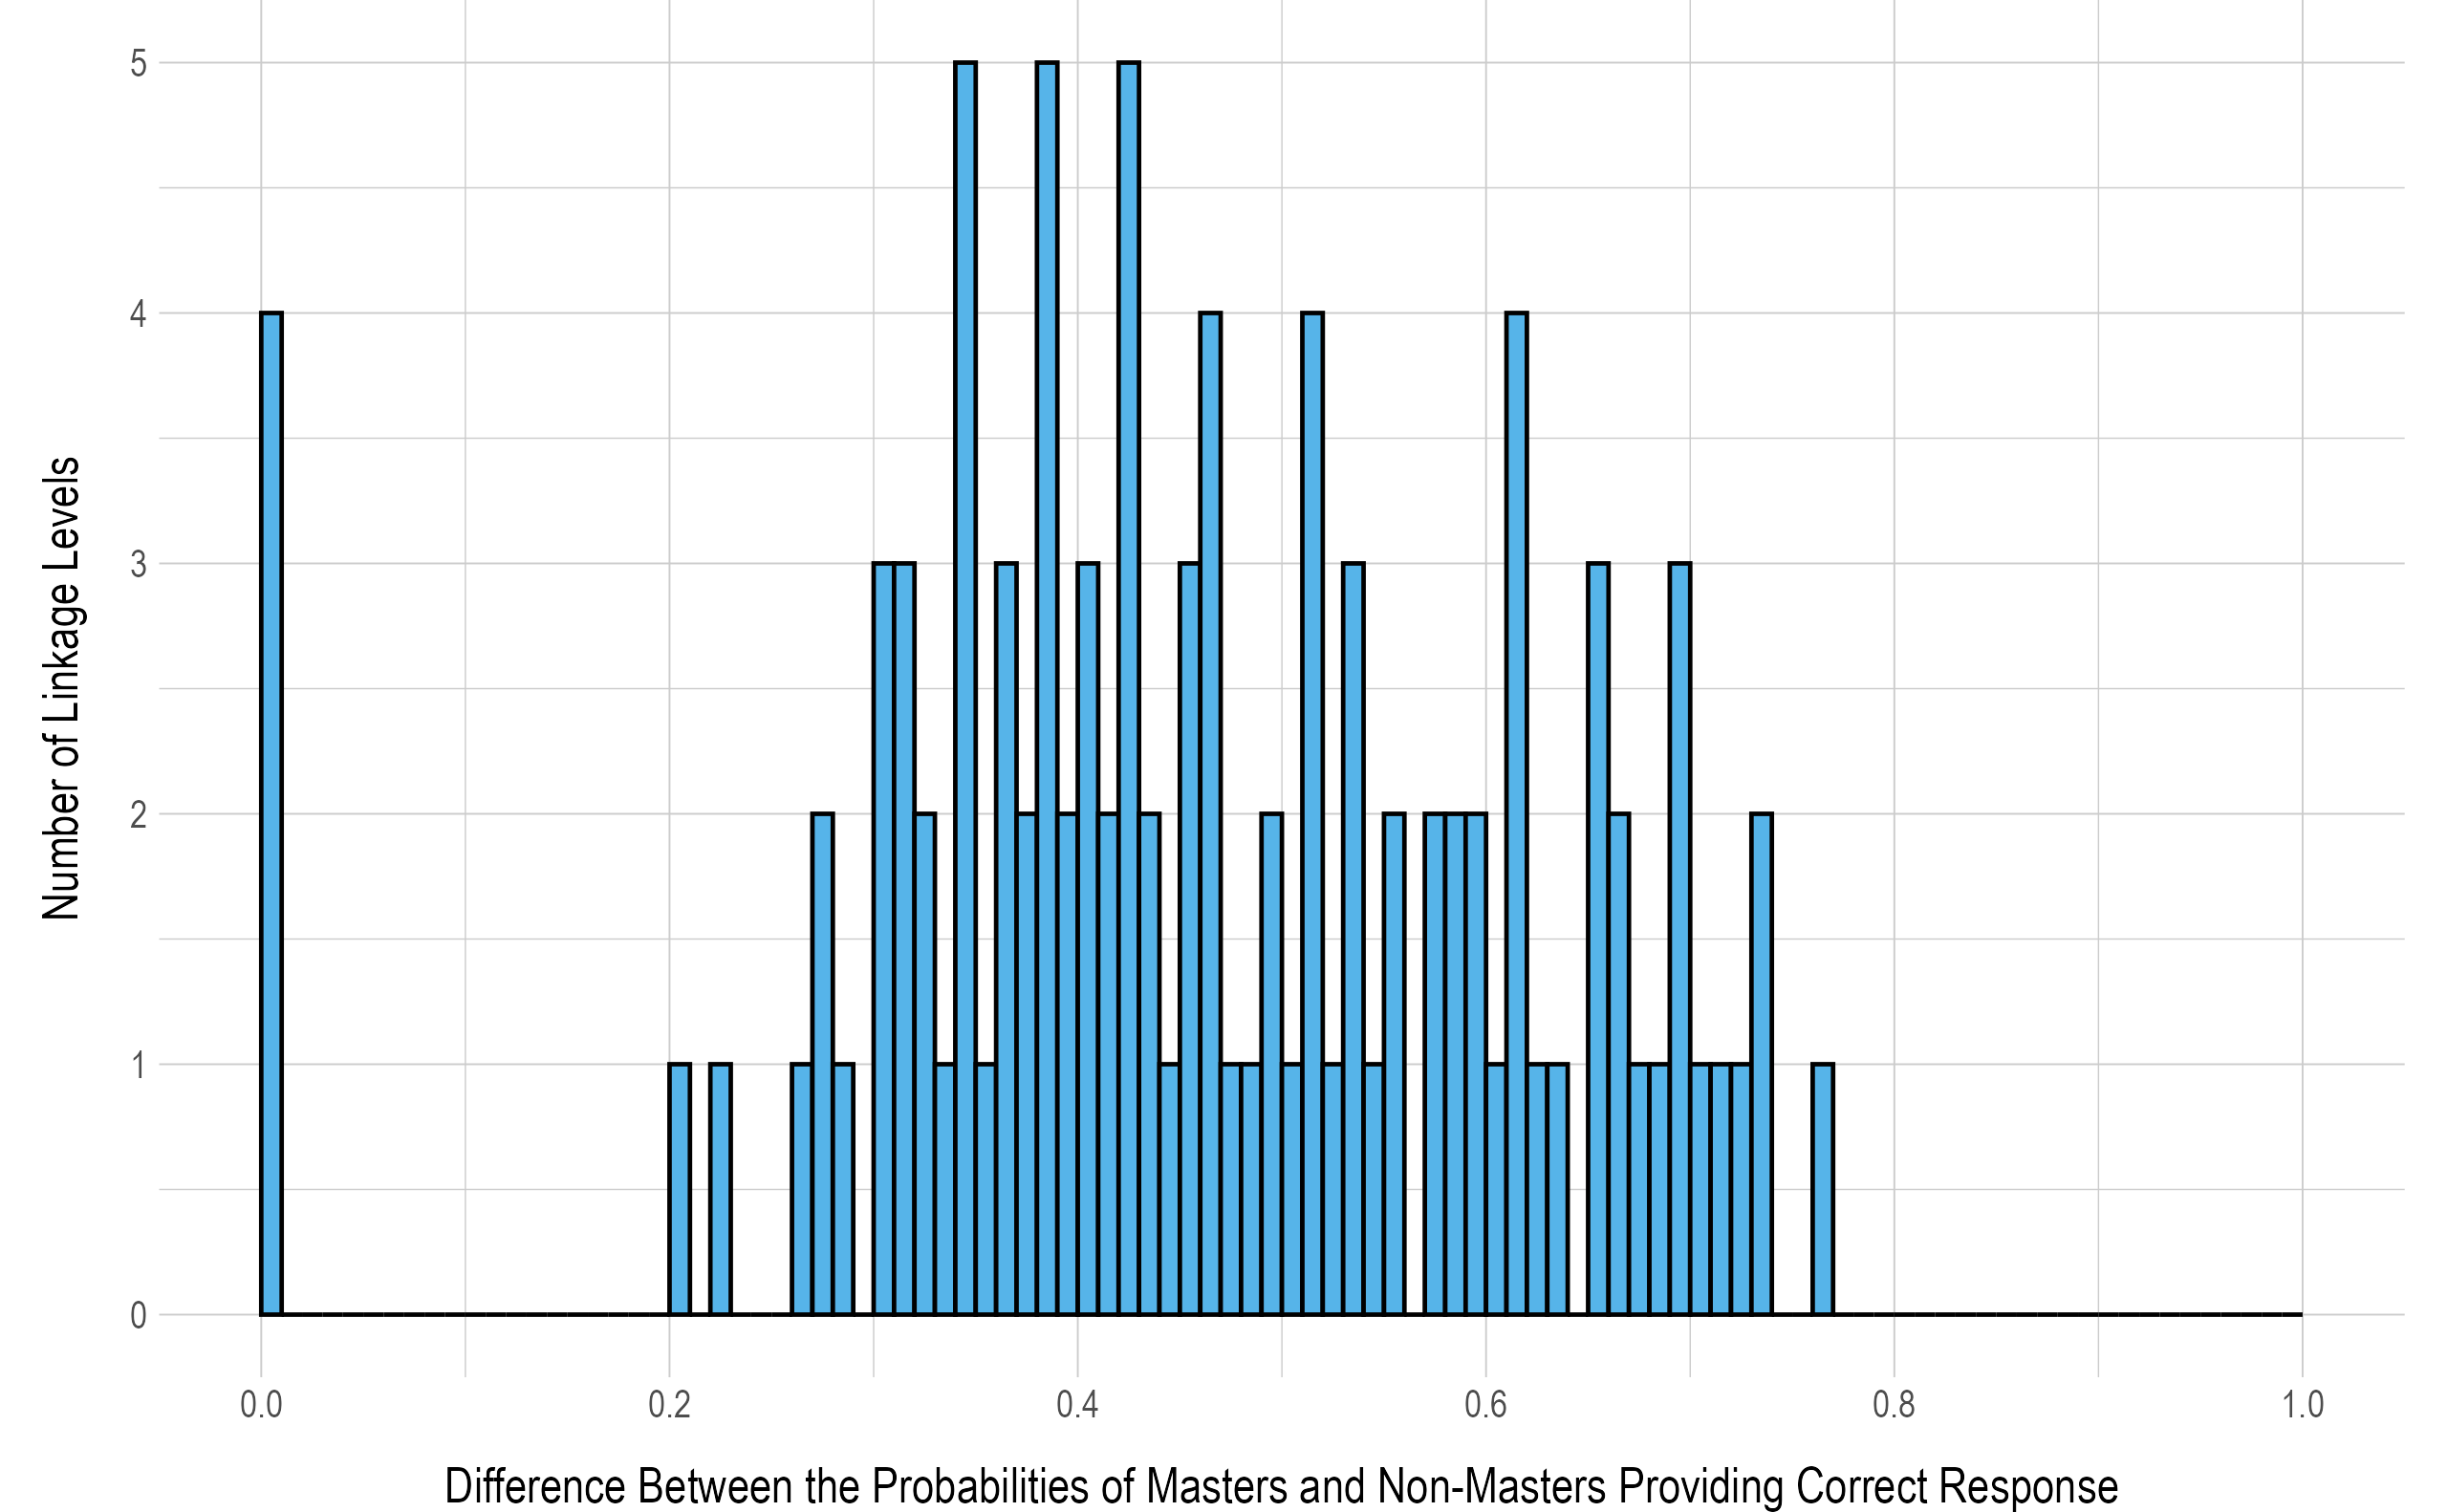
Note. Histogram bins are in increments of .01. Reference line indicates .50.
5.2.4 Base Rate Probability of Mastery
The DLM assessments are designed to maximize the match of student knowledge and skill to the appropriate linkage level content. The base rate of mastery represents the estimated proportion of masters among students assessed on an EE and linkage level. A base rate of mastery close to .50 indicates that students assessed on a given linkage level are equally likely to be a master or non-master. Conversely a high base rate of mastery would indicate that nearly all students testing on a linkage level are classified as masters. Figure 5.4 depicts the distribution of the base rate of mastery probabilities. Overall, 80% of linkage levels (n = 82) had a base rate of mastery between .25 and .75. This indicates that the majority linkage levels are performing as expected. On the edges of the distribution, 7 linkage levels (7%) had a base rate of mastery less than .25, and 13 linkage levels (13%) had a base rate of mastery higher than .75. This indicates that students are more likely to be assessed on linkage levels they have mastered than those they have not mastered.
Figure 5.4: Base Rate of Linkage Level Mastery
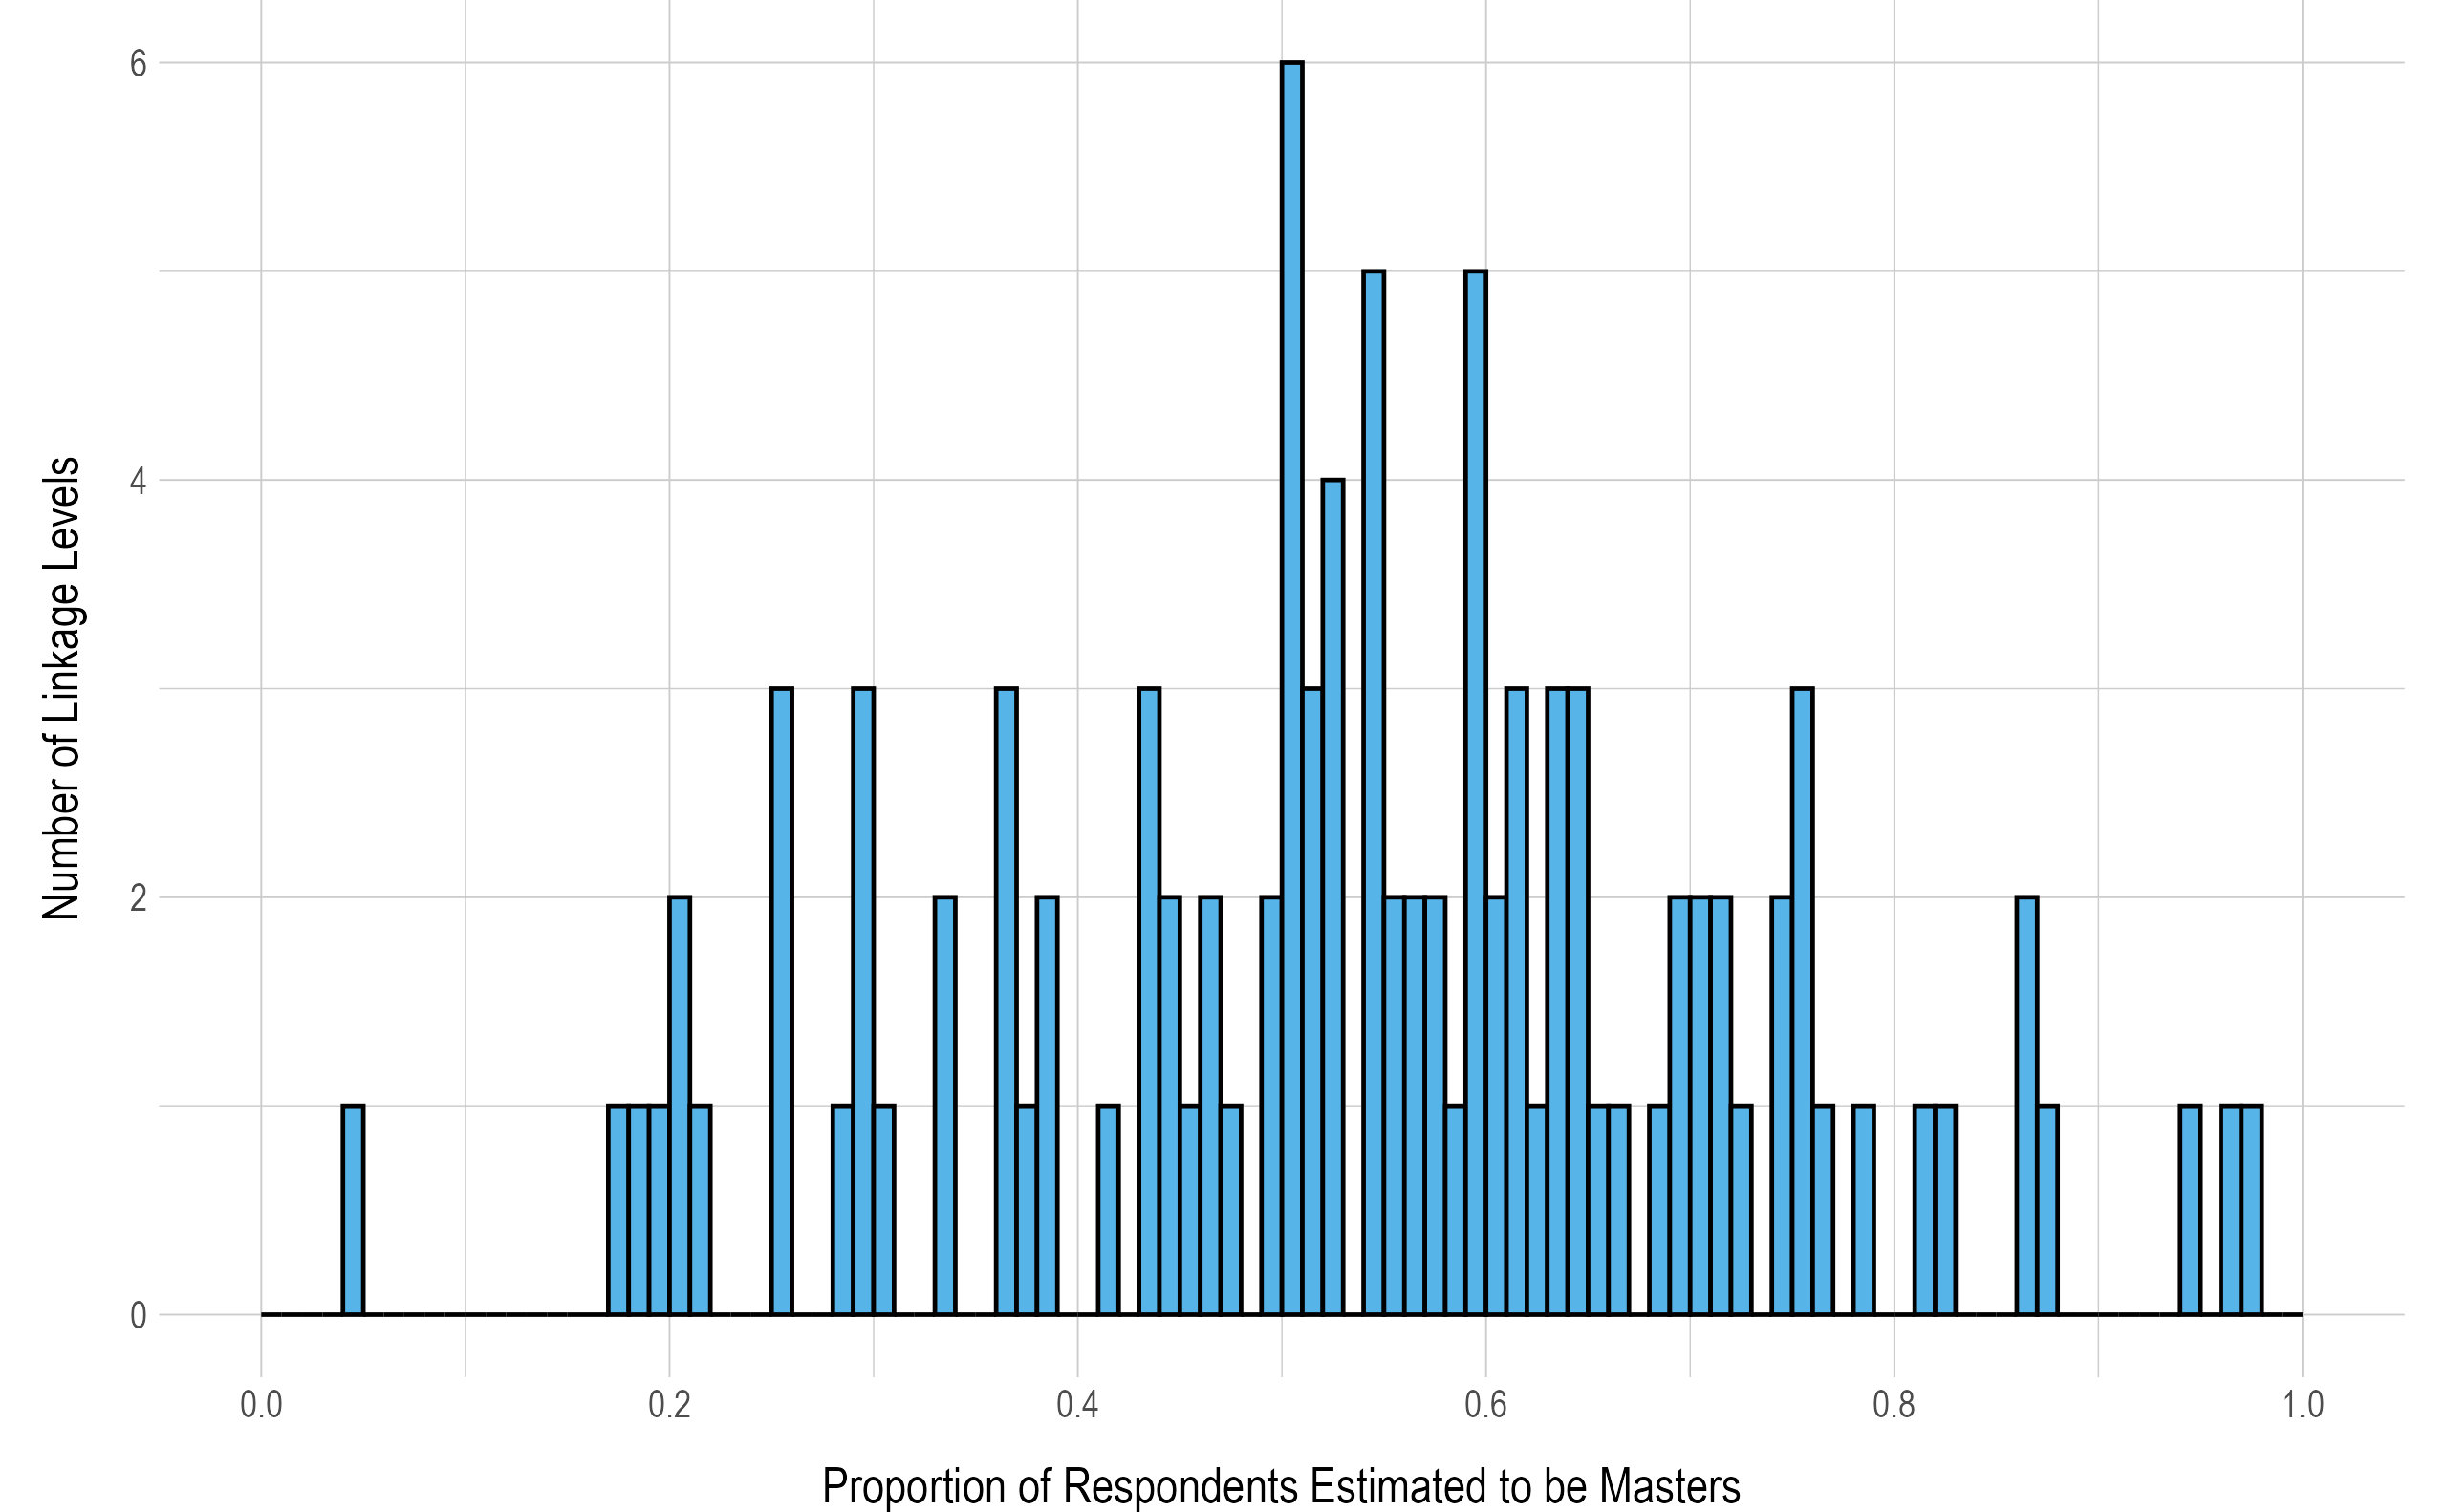
Note. Histogram bins are shown in increments of .01.
5.3 Mastery Assignment
As mentioned, in addition to the calculated posterior probability of mastery, students could be assigned mastery of each linkage level within an EE in two additional ways: by correctly answering 80% of all items administered at the linkage level correctly or by the two-down scoring rule.
The two-down scoring rule is designed to avoid excessively penalizing students who do not show mastery of their tested linkage levels. This rule is used to assign mastery to untested linkage levels. Take, for example, a student who tested only on the Target linkage level of an EE. If the student demonstrated mastery of the Target linkage level, as defined by the .80 posterior probability of mastery cutoff or the 80% correct rule, then all linkage levels below and including the Target level would be categorized as mastered. If the student did not demonstrate mastery on the tested Target linkage level, then mastery would be assigned at two linkage levels below the tested linkage level (i.e., the Initial), rather than showing no evidence of mastery at all. Theoretical evidence for the use of two-down rule is presented in Chapter 2 of the 2015–2016 Technical Manual—Science (Dynamic Learning Maps Consortium, 2017).
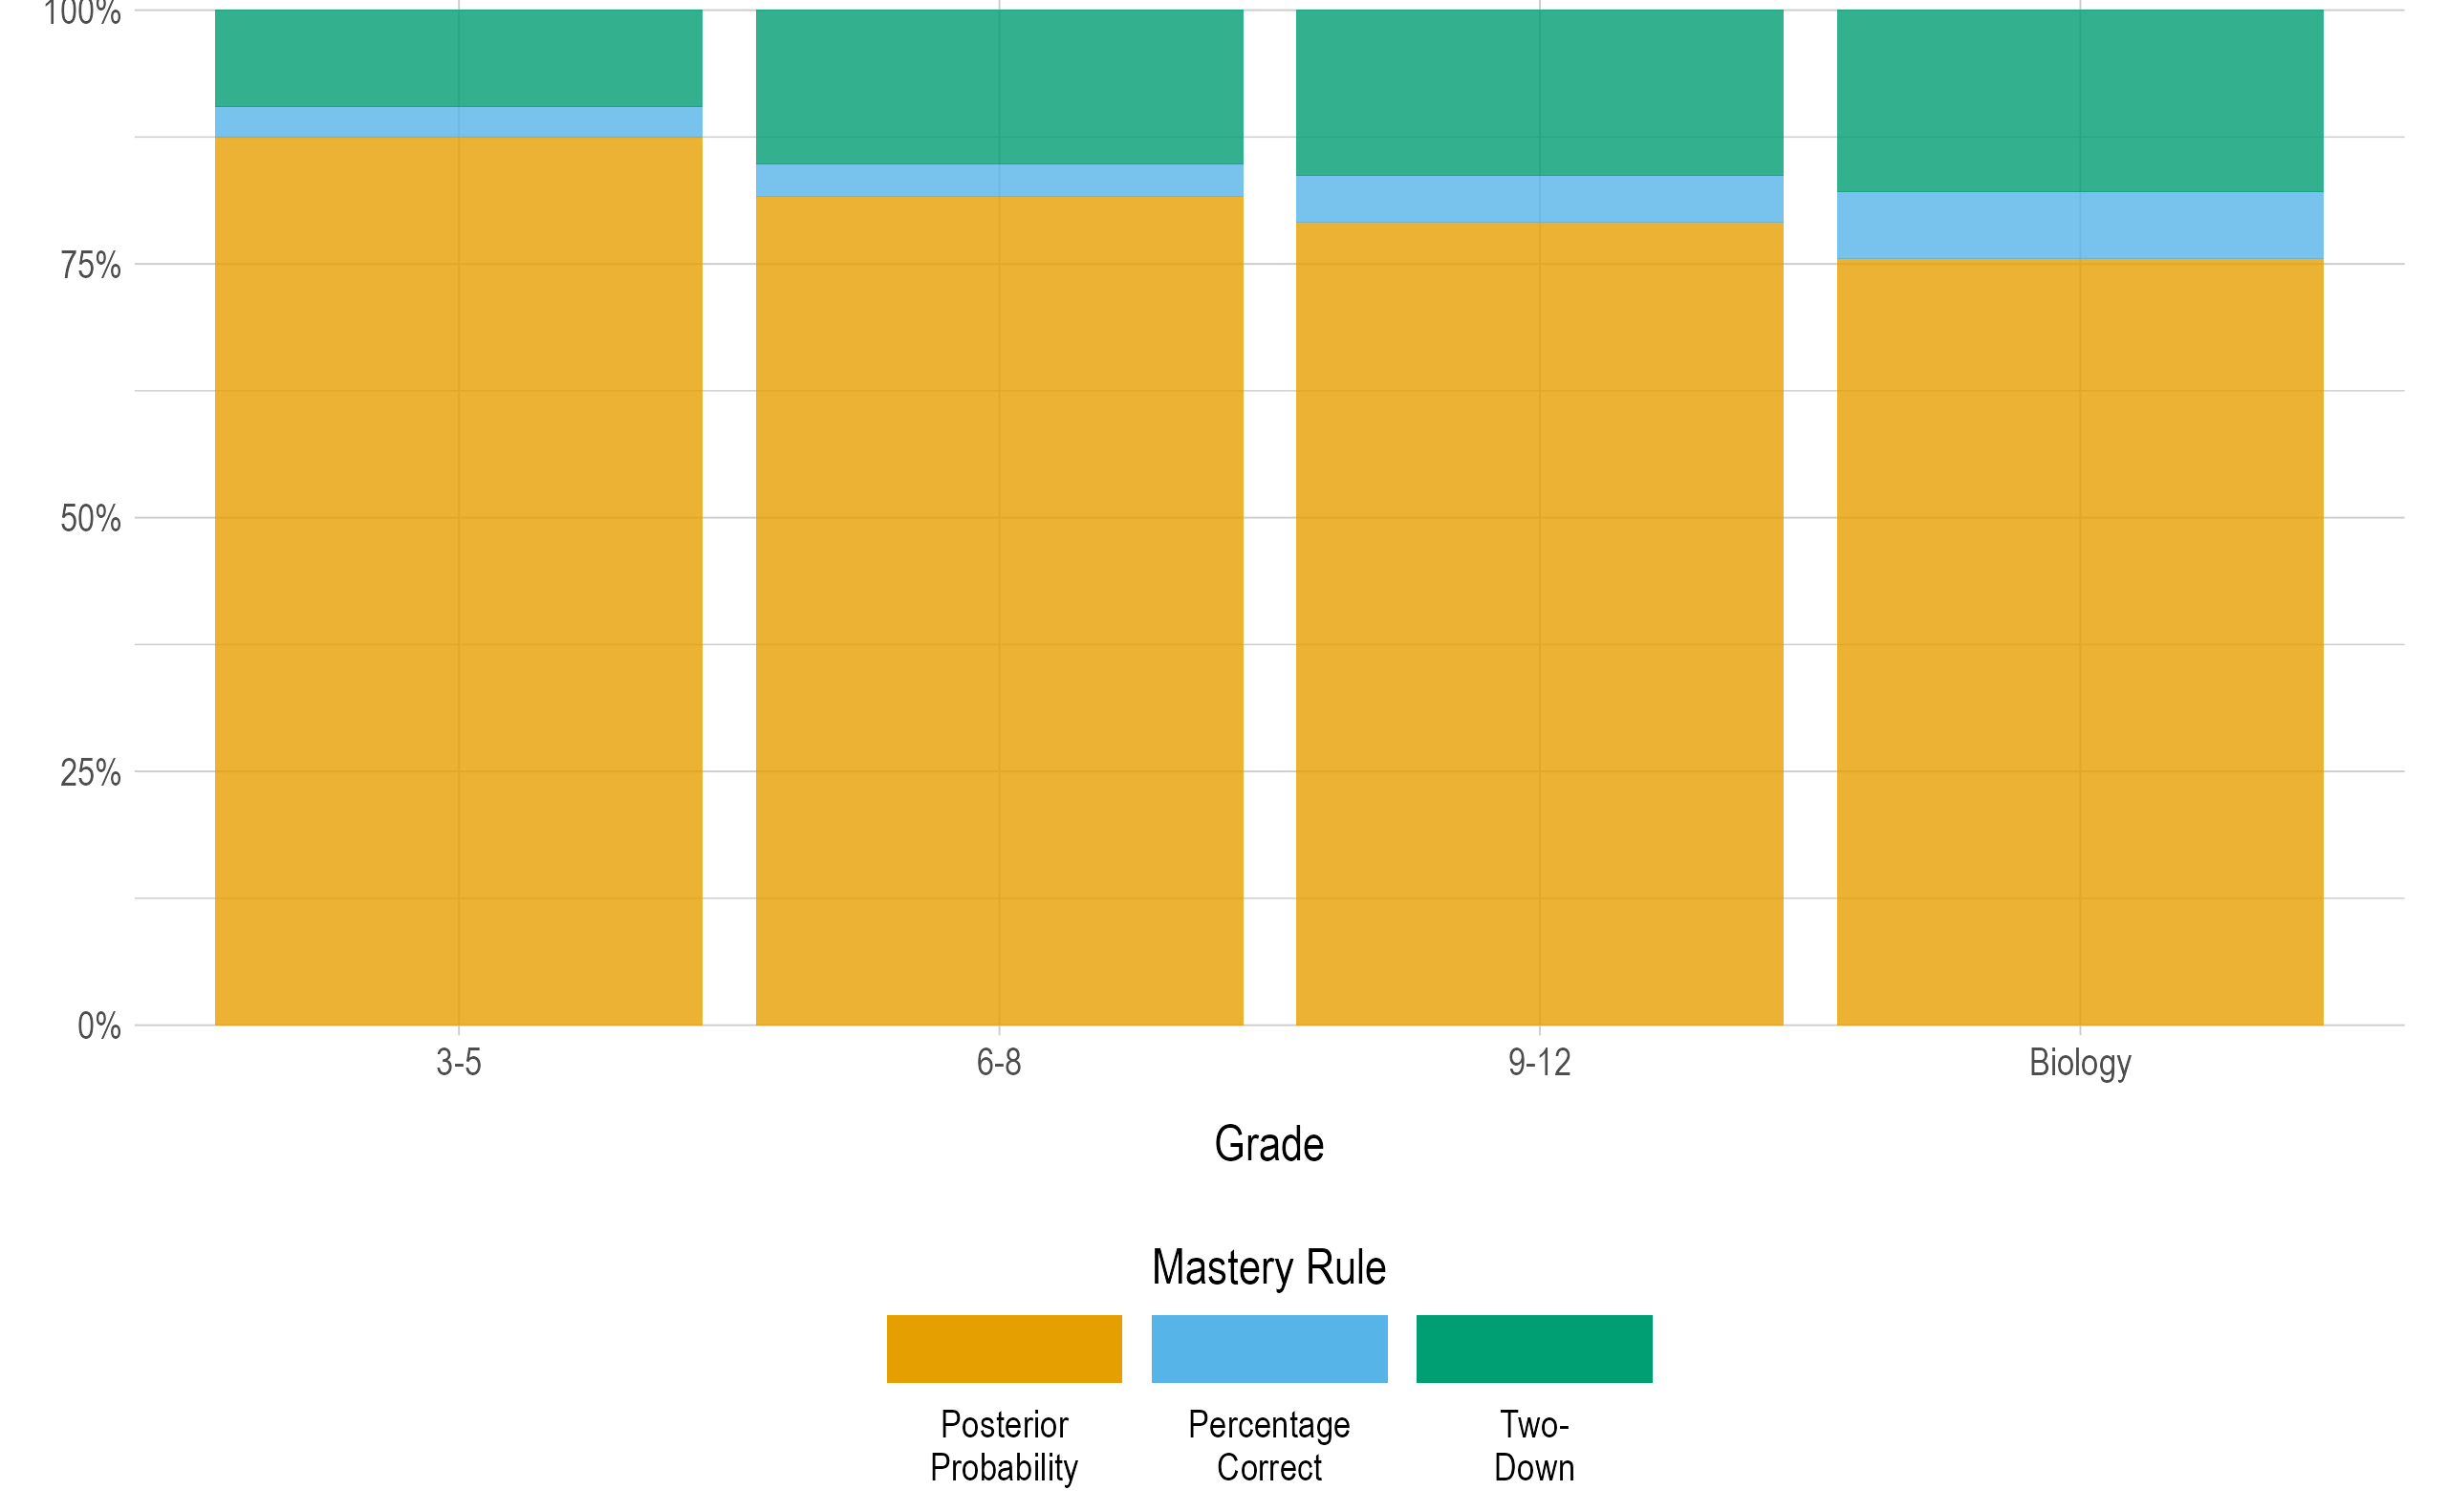
To evaluate the degree to which each mastery assignment rule contributed to students’ linkage level mastery status during the 2020–2021 administration of DLM assessments, the percentage of mastery statuses obtained by each scoring rule was calculated, as shown in Figure 5.5. Posterior probability was given first priority. That is, if multiple scoring rules agreed on the highest linkage level mastered within an EE (e.g., the posterior probability and 80% correct both indicate the Target linkage level as the highest mastered), the mastery status was counted as obtained via the posterior probability. If mastery was not demonstrated by meeting the posterior probability threshold, the 80% scoring rule was imposed, followed by the two-down rule. Across grades, approximately 76% to 87% of mastered linkage levels were derived from the posterior probability obtained from the modeling procedure. Approximately 3% to 7% of linkage levels were assigned mastery status by the percentage correct rule. The remaining approximately 10% to 18% of mastered linkage levels were determined by the minimum mastery, or two-down rule.
Because correct responses to all items measuring the linkage level are often necessary to achieve a posterior probability above the .80 threshold, the percentage correct rule overlapped considerably (but was second in priority) with the posterior probabilities. The percentage correct rule did, however, provide mastery status in those instances where correctly responding to all or most items still resulted in a posterior probability below the mastery threshold. The agreement between these two methods was quantified by examining the rate of agreement between the highest linkage level mastered for each EE for each student. For the 2020–2021 operational year, the rate of agreement between the two methods was 84%. However, in instances where the two methods disagreed, the posterior probability method indicated a higher level of mastery (and therefore was implemented for scoring) in 77% of cases. Thus, in some instances the posterior probabilities allowed students to demonstrate mastery when the percentage correct was lower than 80% (e.g., a student completed a four-item testlet and answered three of four items correctly).
Figure 5.5: Linkage Level Mastery Assignment by Mastery Rule for Each Grade
5.4 Model Fit
Model fit has important implications for the validity of inferences that can be made from assessment results. If the model used to calibrate and score the assessment does not fit the data well, results from the assessment may not accurately reflect what students know and can do. Relative and absolute model fit were compared following the 2017 administration. Model fit research was also prioritized during the 2017–2018, 2018–2019, and 2019–2020 operational years, and frequent feedback was provided by the DLM Technical Advisory Committee (TAC) modeling subcommittee, a subgroup of TAC members focused on reviewing modeling-specific research.
For a complete description of the methods and process used to evaluate model fit, see Chapter 5 of the 2016–2017 Technical Manual Update—Science (Dynamic Learning Maps Consortium, 2018a).
5.5 Conclusion
In summary, the DLM modeling approach uses well-established research in Bayesian inference networks and diagnostic classification modeling to determine student mastery of skills measured by the assessment. Latent class analyses are conducted for each linkage level of each EE to determine the probability of student mastery. Items within the linkage level are assumed to be fungible, with equivalent item probability-parameters for masters and non-masters, owing to the conceptual approach used to construct DLM testlets. For each linkage level, a mastery threshold of .80 is applied, whereby students with a posterior probability greater than or equal to the threshold are deemed masters, and students with a posterior probability below the threshold are deemed non-masters. To ensure students are not excessively penalized by the modeling approach, in addition to posterior probabilities of mastery obtained from the model, two additional scoring procedures are implemented: percentage correct at the linkage level and a two-down scoring rule.