3 Item and Test Development
Chapter 3 of the 2015–2016 Technical Manual—Science (Dynamic Learning Maps Consortium, 2017) describes item and test development procedures. This chapter provides an overview of updates to item and test development for the 2020–2021 academic year. The first portion of the chapter provides an overview of 2020–2021 item writers’ characteristics, followed by the 2020–2021 external review of items, testlets, and texts based on criteria for content, bias, and accessibility. The next portion of the chapter describes changes to the pool of operational and field test testlets available for administration during 2020–2021.
For a complete description of item and test development for DLM assessments, including information on the use of evidence-centered design and Universal Design for Learning in the creation of concept maps used to guide test development, see the 2015–2016 Technical Manual—Science (Dynamic Learning Maps Consortium, 2017).
3.1 Items and Testlets
This section describes information pertaining to item writing and item writer demographics for the 2020–2021 year. For a complete summary of item and testlet development procedures that were developed and implemented in 2015–2016 and continue to be used in 2020–2021, see Chapter 3 of the 2015–2016 Technical Manual—Science (Dynamic Learning Maps Consortium, 2017).
3.1.1 Item Writing
Item development for 2020–2021 was reduced in scope to support an initiative to review and refresh resources that guide the development of items and testlets.
3.1.1.1 Item Writers
Item writers were selected from the ATLAS Recruitment Platform based on predetermined qualifications such as special education teaching experience and previous DLM item writing experience. The ATLAS Recruitment Platform is a profile-based recruitment tool hosted in MemberClicks, a membership management software. Individuals create their participant profile, which can be accessed and updated at any time. We encourage individuals to update their profile information annually or at the time of event recruitment for reporting accuracy. Participant profiles include attribute fields to capture demographic, education, and work experience data. Item writers were assigned to a subject area based on their qualifications and previous DLM item writing experience. In total, seven science item writers contributed to writing testlets during the 2020–2021 year.
The median and range of years of item writers’ teaching experience is shown in Table 3.1. Of the item writers who responded to the item, the median years of experience was 7 years for item writers of science testlets in pre-K–12 and 4 years of special education experience.
| Area | n | Median | Range |
|---|---|---|---|
| Pre-K–12 | 7 | 12.0 | 8–26 |
| Science | 6 | 11.0 | 8–26 |
| Special education | 4 | 9.5 | 3–20 |
| * The n columns indicate the number of nonmissing responses to the survey question |
The types of degrees held by item writers are shown in Table 3.2. All science item writers held at least a bachelor’s degree. All science item writers also held a master’s degree, for which the most common field of study was special education (n = 5; 71%).
| Degree | n |
|---|---|
| Bachelor’s degree | |
| Education | 1 |
| Content specific | 2 |
| Special education | 1 |
| Other | 1 |
| Missing | 2 |
| Master’s degree | |
| Education | 0 |
| Content specific | 1 |
| Special education | 5 |
| Other | 1 |
| Missing | 0 |
Item writers reported a range of experience working with students with different disabilities, as summarized in Table 3.3. Item writers collectively had the most experience working with students with an emotional disability, a mild cognitive disability, or a specific learning disability.
| Disability category | n | % |
|---|---|---|
| Blind/Low vision | 2 | 28.6 |
| Deaf/Hard of hearing | 3 | 42.9 |
| Emotional disability | 6 | 85.7 |
| Mild cognitive disability | 6 | 85.7 |
| Multiple disabilities | 5 | 71.4 |
| Orthopedic impairment | 2 | 28.6 |
| Other health impairment | 5 | 71.4 |
| Significant cognitive disability | 5 | 71.4 |
| Specific learning disability | 6 | 85.7 |
| Speech impairment | 5 | 71.4 |
| Traumatic brain injury | 3 | 42.9 |
3.1.1.2 Item Writing Process
The selected item writers participated in a 1-day refresher virtual meeting that was held on February 10, 2021. Item writer refresher training included a review of the item writing process and procedures for reviewing peers’ items. Following the training, item writing pairs collaborated and began the development of testlets. Following the refresher meeting, item writers continued producing and peer reviewing testlets virtually via a secure online platform through April 2021. A total of 28 testlets were written for science.
3.2 External Reviews
The purpose of panelists externally reviewing items and testlets developed for the DLM Alternate Assessment System is to evaluate whether the items and testlets measure the intended content, are accessible, and are free of biased or sensitive content. Panelists use external review criteria established for DLM alternate assessments to recommend items be accepted, revised, or rejected. Panelists also provide recommendations for revisions or an explanation for a reject rating. The test development team uses the collective feedback from the panelists to inform decisions about items and testlets before they are field-tested.
External review for 2020–2021 changed from a 2-day onsite event to 49 virtual 4-hour panel meetings that spanned over 3 weeks due to travel restrictions caused by the COVID-19 pandemic. Materials were updated to meet the needs of virtual panel meetings, including the advance training and facilitator and co-facilitator training. When held in person, one facilitator led the feedback discussion for each panel. This year, a facilitator and co-facilitator led the feedback discussions and recorded decisions for each panel meeting.
3.2.1 Review Recruitment, Assignments, and Training
Panelists were selected from the ATLAS Recruitment Platform based on predetermined qualifications for each panel type. The ATLAS Recruitment Platform is populated using a profile creation survey that captures demographic, education, and work experience of candidates from DLM partner states. Panelists were assigned to content, accessibility, or bias and sensitivity panels based on their qualifications.
In fall 2020, there were 57 science panelists (23 accessibility panelists, 19 content panelists, and 15 bias and sensitivity panelists).
Prior to participating in the virtual panel meetings, panelists completed an advance training course that included an External Review Procedures module and a module for their assigned panel type. The content modules were subject specific, while the accessibility and bias and sensitivity modules were universal for all subjects. After each module, panelists completed a quiz and were required to score 80% or higher to pass advance training.
After completing the modules and corresponding quizzes, panelists completed a practice activity that simulated the external review process for each panel type. Panelists used the criteria for their assigned panel type to complete this external review.
Following the completion of advance training, panelists completed asynchronous reviews on two or three collections of testlets dependent upon panel type. Collections had between 34 and 54 testlets, dependent on the panel type. Content panels had fewer testlets per collection, and bias and sensitivity and accessibility panels had more testlets per collection. Ratings from the asynchronous reviews were sorted and new collections were created containing items and testlets with discrepant ratings by a panel. Dependent on the subject, there were two to four virtual panel meetings led by facilitators and co-facilitators to obtain collective feedback about the items and testlets.
The professional roles reported by the 2020–2021 panelists are shown in Table 3.4. Roles include classroom teacher, district staff, instructional coach, and other. Examples of “other” roles included administrators, program coordinators, process coordinators, supervisors of instruction, assessment coordinators, content leads, instruction supervisors, and individuals identifying with multiple categories.
| Role | n | % |
|---|---|---|
| Classroom teacher | 44 | 77.2 |
| District staff | 5 | 8.8 |
| Other | 8 | 14.0 |
Panelists had varying experience teaching students with the most significant cognitive disabilities. Science panelists had a median of 14 years of experience teaching students with the most significant cognitive disabilities, with a minimum of 2 and a maximum of 30 years of experience.
Science panelists were from 15 different states and the District of Columbia. Population density of schools in which panelists taught or held a position is reported in Table 3.5. Within the profile creation survey, rural was defined as a population living outside settlements of 1,000 or fewer inhabitants, suburban was defined as an outlying residential area of a city of 2,000–-49,999 inhabitants, and urban was defined as a city of 50,000 inhabitants or more.
| Population density | n | % |
|---|---|---|
| Rural | 21 | 36.8 |
| Suburban | 16 | 28.1 |
| Urban | 19 | 33.3 |
| Not applicable | 1 | 1.8 |
Panelists recommended most content be accepted. For science, 273 testlets containing 1,365 items were reviewed. The percentage of items rated as accept across grade bands, panels, and rounds of review ranged from 65% to 90%. The percentage of testlets rated as accept across grade bands, panels, and rounds of review ranged from 82% to 97%. The percentage of items and testlets rated as revise across grade bands, panels, and rounds of review ranged from 9% to 31% and 3% to 17%, respectively. The rate at which items and testlets were recommended for rejection ranged from 0.4% to 2% and 1% to 5% respectively, across grade bands, panels, and rounds of review.
3.2.2 Test Development Decisions
Because each item and testlet is examined by three distinct panels, ratings were compiled across panel types, following the process established in 2017–2018. The test development team reviewed the collective feedback provided by the panelists for each item and testlet. There are five decision options for the test development team to apply to each item and testlet: (a) accept as is, no pattern of similar concerns (b) minor revision, pattern of minor concerns, will be addressed; (c) major revision needed; (d) reject; and (e) more information needed. Once the test development team views each item and testlet and considers the feedback provided by the panelists, it assigns a decision to each one.
The science test development team accepted as is, 78% of testlets and 48% of items. Of the items and testlets that were revised, most required major changes (e.g., stem or response option replaced) as opposed to minor changes (e.g., minor rewording but concept remained unchanged). The science test development team made 103 minor revisions, 558 major revisions to items, and rejected 13 testlets. Most of the items and testlets reviewed will be field tested during the 2021 fall or 2022 spring windows.
3.3 Operational Assessment Items for 2020–2021
Testlets were made available for operational testing in 2020–2021 based on the 2019–2020 operational pool. Table 3.6 summarizes the total number of operational testlets for 2020–2021. In total, there were 156 operational testlets available. This total included 36 EE/linkage level combinations for which both a general version and a version for students who are blind or visually impaired or read braille were available.
A total of 270,398 test sessions were administered during the spring assessment window. One test session is one testlet taken by one student. Only test sessions that were complete at the close of each testing window counted toward the total sessions.
| Grade | n |
|---|---|
| Elementary | 39 |
| Middle school | 44 |
| High school | 42 |
| Biology | 31 |
| Note: Three EEs are shared across the high school and Biology assessments. |
Similar to previous years, the proportion correct (p-value) was calculated for all operational items to summarize information about item difficulty.
Figure 3.1 shows the p-values for each operational item in science. To prevent items with small sample sizes from potentially skewing the results, the sample size cutoff for inclusion in the p-value plots was 20. The p-values for most science items were between .4 and .7.
Figure 3.1: Probabilities for Science 2021 Operational Items
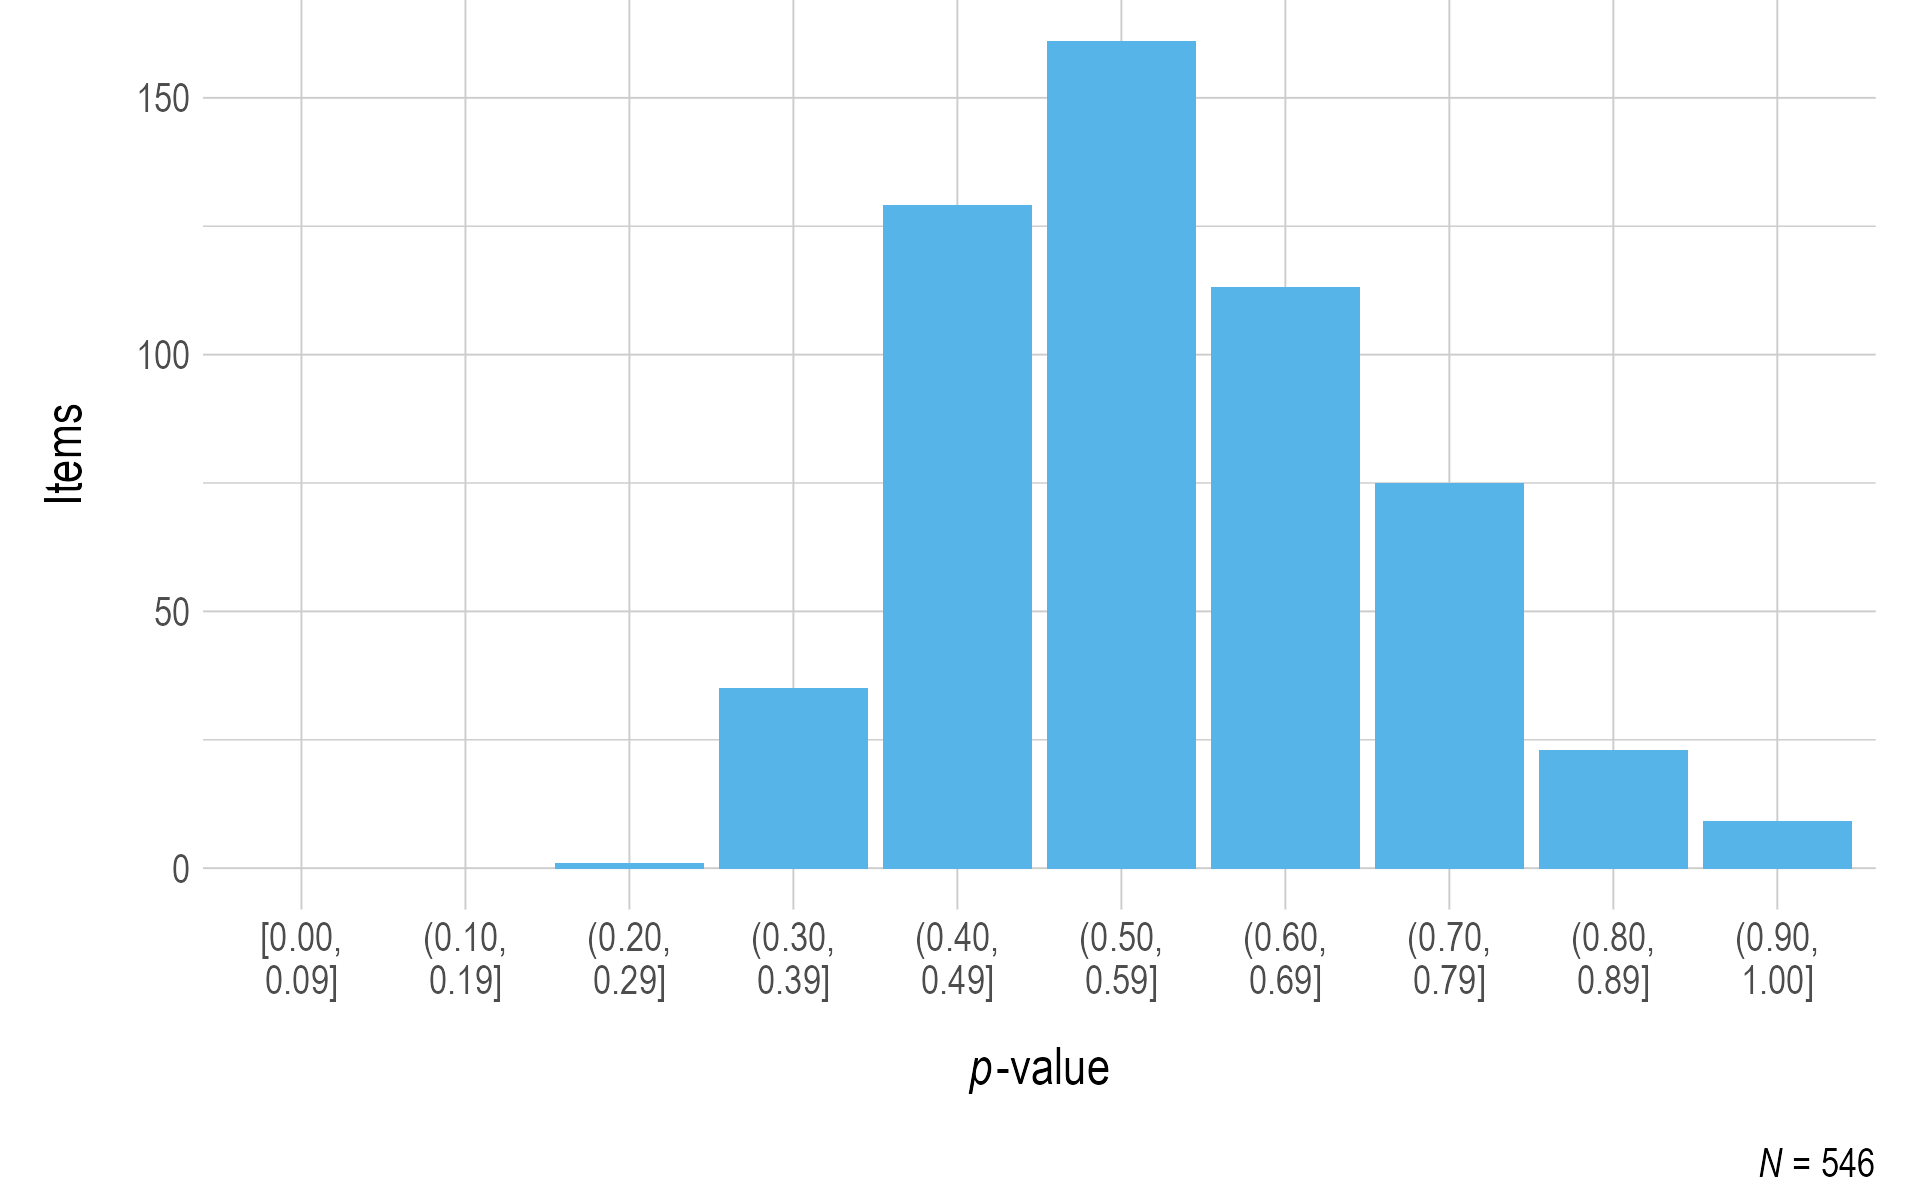
Note. Items with a sample size of less than 20 were omitted.
Standardized difference values were also calculated for all operational items, with a student sample size of at least 20 required to compare the p-value for the item to all other items measuring the same EE and linkage level. The standardized difference values provide one source of evidence of internal consistency.
Figure 3.2 summarizes the standardized difference values for operational items for science.. Most items fell within two standard deviations of the mean of all items measuring the EE and linkage level. As additional data are collected and decisions are made regarding item pool replenishment, test development teams will consider item standardized difference values, along with item misfit analyses, when determining which items and testlets are recommended for retirement.
Figure 3.2: Standardized Difference Z-Scores for Science 2020–2021 Operational Items
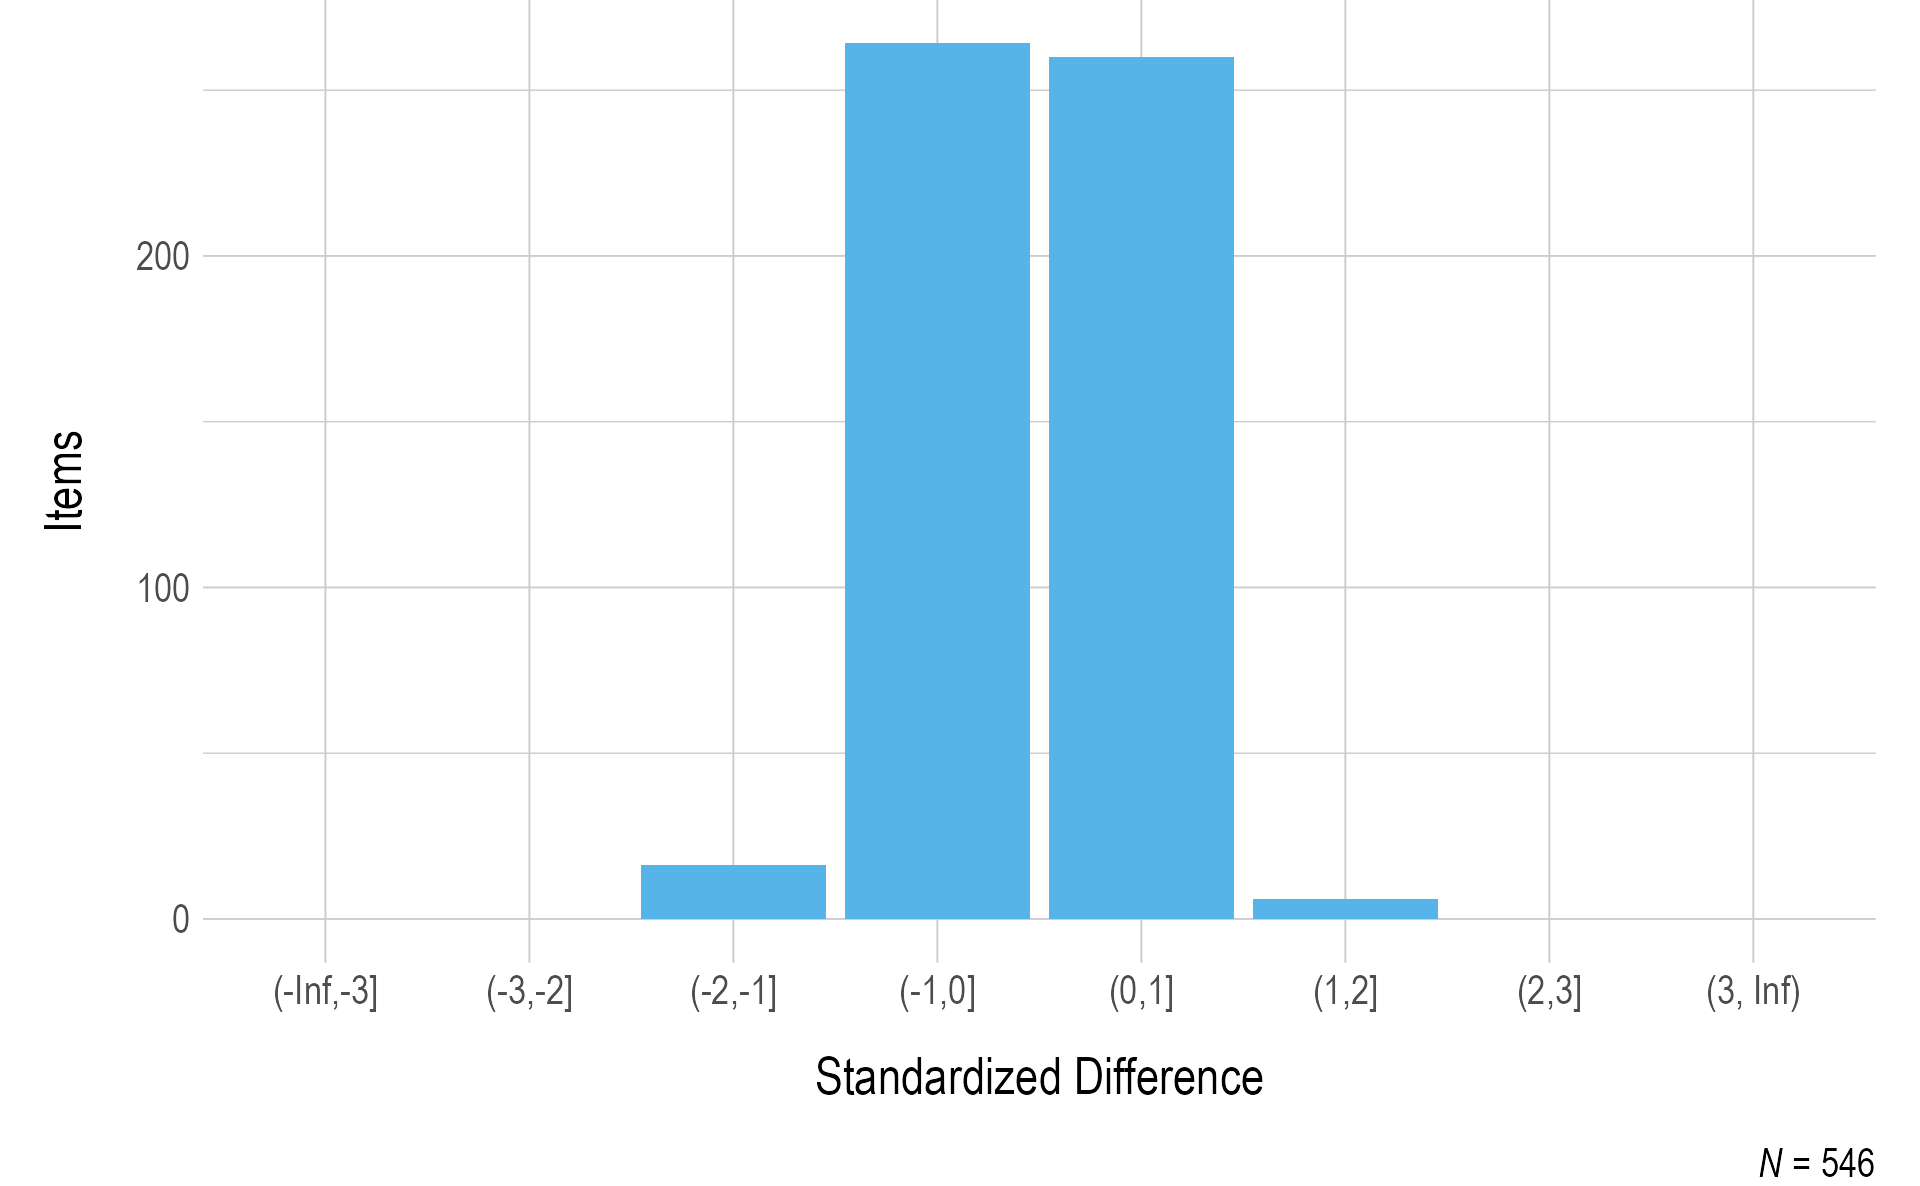
Note. Items with a sample size of less than 20 were omitted.
Figure 3.3 summarizes the standardized difference values for operational items by linkage level. Most items fell within two standard deviations of the mean of all items measuring the respective EE and linkage level, and the distributions are consistent across linkage levels.
Figure 3.3: Standardized Difference Z-Scores for 2020–2021 Operational Items by Linkage Level
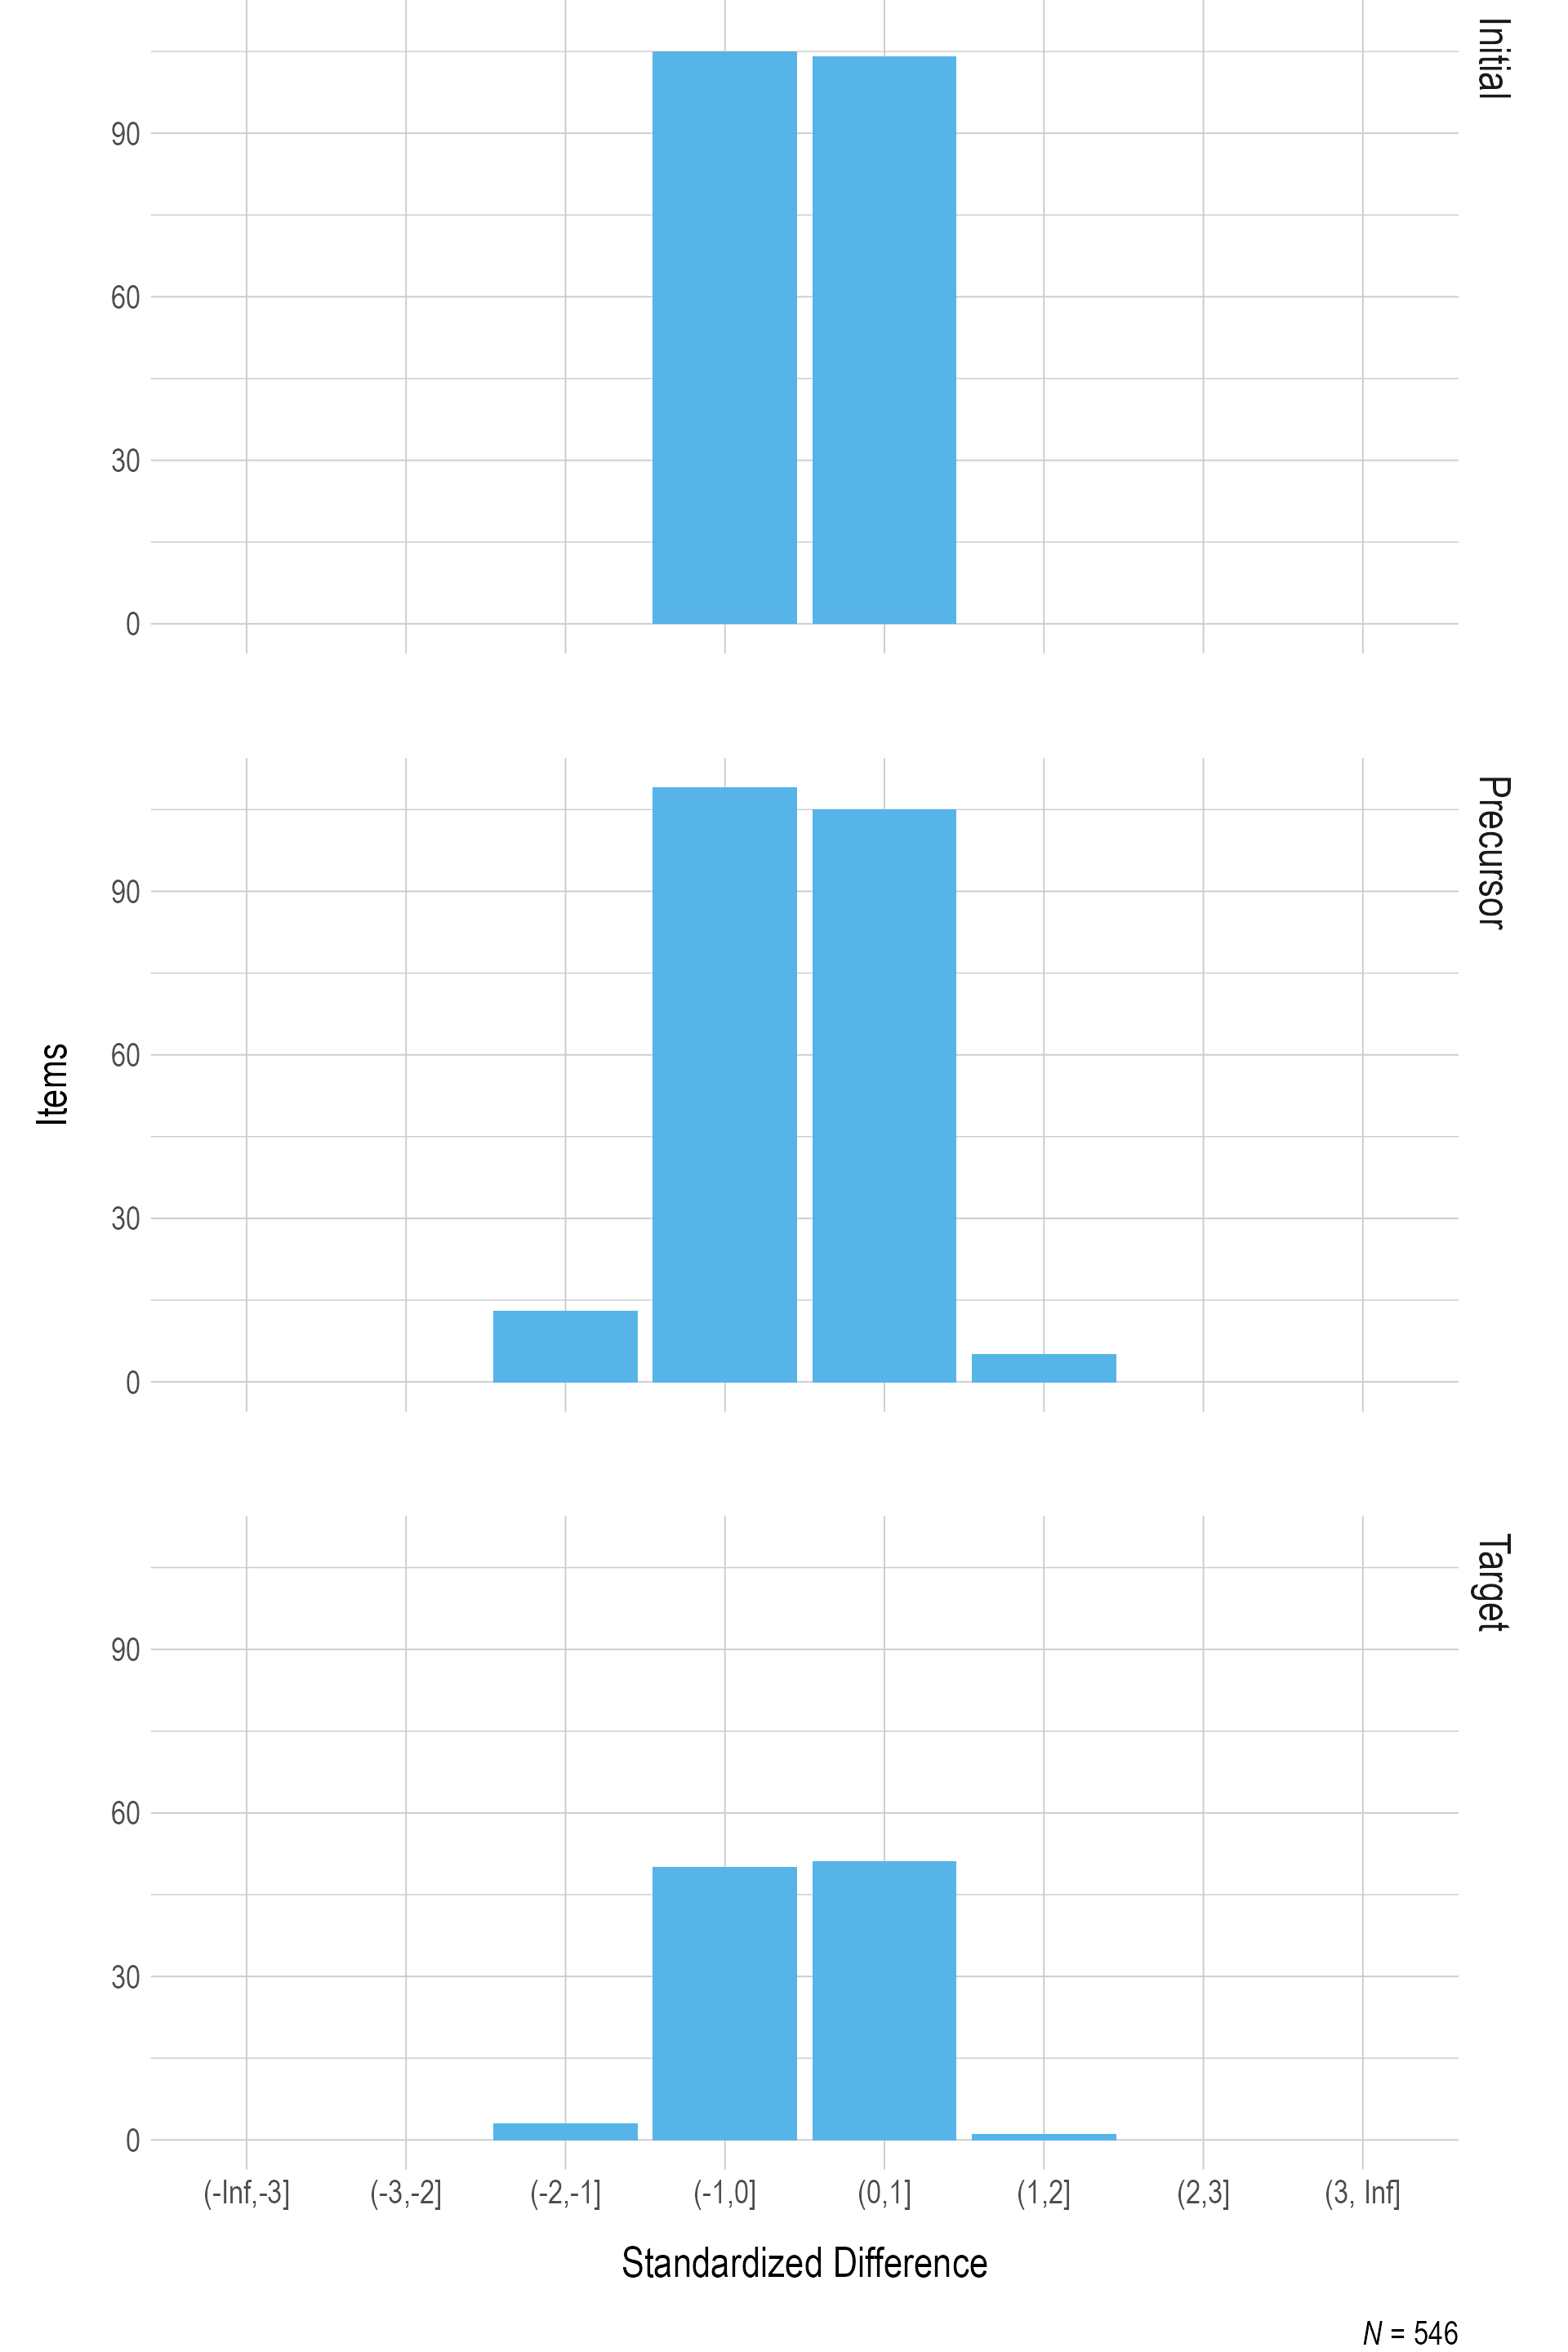
Note. Items with a sample size of less than 20 were omitted.
3.4 Field Testing
During the 2020–2021 year, DLM field tests were administered to evaluate item quality for EEs assessed at each grade level for science. Field testing is conducted to deepen operational pools so that multiple testlets are available in the spring window, including making more content available at EEs and linkage levels that teachers administer to students the most. By deepening the operational pool, testlets can also be evaluated for retirement in instances in which other testlets perform better.
In this section we describe the field tests administered in 2020–2021 and the associated review activities. A summary of prior field test events can be found in Chapter 3 of the 2015–2016 Technical Manual—Science (Dynamic Learning Maps Consortium, 2017) and subsequent annual DLM technical manual updates.
3.4.1 Description of Field Tests Administered in 2021
Field tests were administered after completion of the operational assessment in the spring. A field test testlet was assigned for an EE that was assessed during the operational assessment at a linkage level equal or adjacent to the linkage level of the operational testlet.
Testlets were made available for field testing in the spring assessment window based on the availability of field test content for each EE and linkage level. Table 3.7 summarizes the number of field test testlets available during 2021. A total of 86 were available across grades.
| Grade | n |
|---|---|
| Elementary | 26 |
| Middle school | 26 |
| High school | 21 |
| Biology | 13 |
Participation in field testing was not required, but teachers were encouraged to administer all available testlets to their students. In total, 19,408 (63%) students completed at least one field test testlet. In the spring assessment window, 85% of field test testlets had a sample size of at least 20 students (i.e., the threshold for item review).
3.4.2 Field Test Data Review
Data collected during each field test are compiled, and statistical flags are implemented ahead of test development team review. Flagging criteria serve as a source of evidence for test development teams in evaluating item quality; however, final judgments are content based, taking into account the testlet as a whole, the underlying nodes in the DLM maps that the items were written to assess, and pool depth.
Review of field test data occurs annually during February and March. This includes data from the previous spring assessment window. That is, the review in February and March of 2021 includes field test data collected during the 2020 spring assessment window. Data that was collected during the 2021 spring assessment window will be reviewed in February and March of 2022, with results included in the 2021–2022 technical manual update.
Due to the COVID-19 pandemic, field test data from spring 2020 were unavailable; therefore, there were no science field test testlets to review in 2021.
3.5 Conclusion
During the 2020–2021 academic year, the test development teams conducted reduced, virtual events for both item writing and external review. Overall, 28 testlets were written for science. Additionally, following external review, the science test development team made 103 minor revisions, 558 major revisions to items, and rejected 13 testlets. Of the content already in the operational pool, most items had p-values within two standard deviations of the mean for the EE and linkage level. Field testing in 2020–2021 focused on collecting data from students on new content to refresh the operational pool of testlets.